Trends in Precision Soil Testing and Average Soil Nitrate Levels (1986-2015)
This detailed content provides insights into the trends in precision soil testing, comparing zone/grid samples to total samples, and the variability of soil nitrate levels following wheat and barley crops. It includes visual representations of data from various regions and years, offering valuable information on soil testing practices and nitrate levels over two decades.

Download Presentation

Please find below an Image/Link to download the presentation.
The content on the website is provided AS IS for your information and personal use only. It may not be sold, licensed, or shared on other websites without obtaining consent from the author. Download presentation by click this link. If you encounter any issues during the download, it is possible that the publisher has removed the file from their server.
E N D
Presentation Transcript
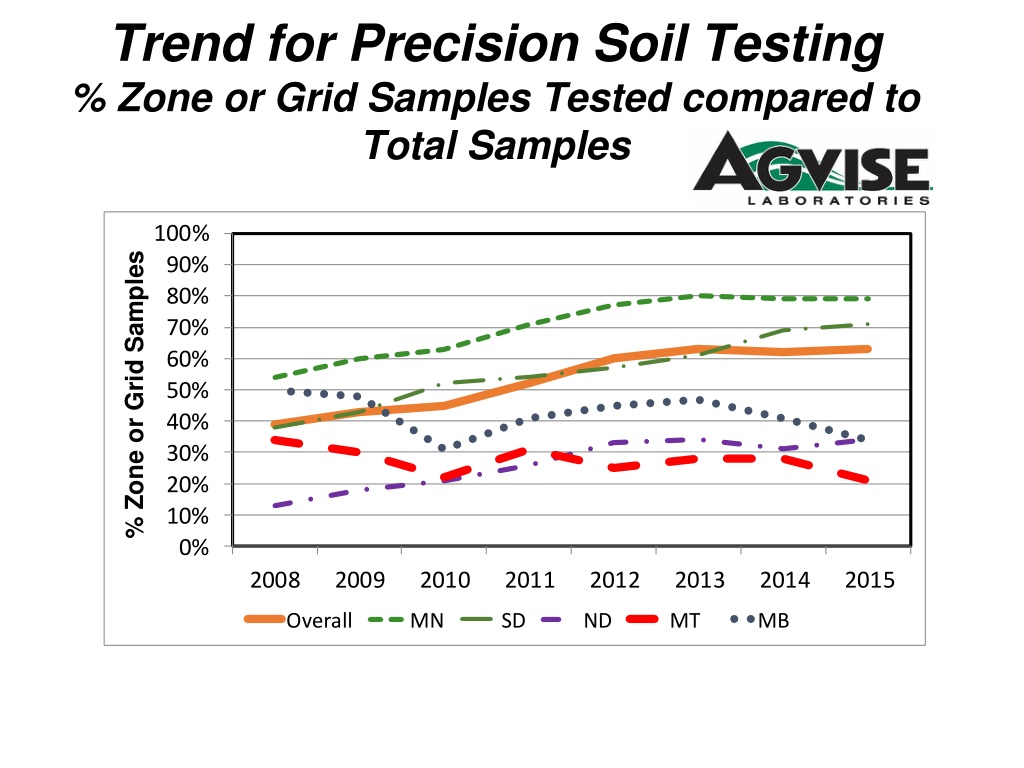
Trend for Precision Soil Testing % Zone or Grid Samples Tested compared to Total Samples 100% % Zone or Grid Samples 90% 80% 70% 60% 50% 40% 30% 20% 10% 0% 2008 2009 2010 2011 2012 2013 2014 2015 Overall MN SD ND MT MB
%Zone or Grid Samples Tested Compared to Conventional Whole Field Composite Samples in 2015 100% 90% 79% 80% 71% 70% 63% 60% 50% 40% 34% 34% 30% 21% 20% 10% 0% MN ND SD MT MB Overall
AGVISE Laboratories %Zone or Grid Samples Northwood laboratory 1997 - 2015 70% 60% % Grid or Zone Samples Tested Compared To Conventional Whole Field Composite Samples Tested 50% 39%40%39%41% 40% 26%28%31%33% 30% 22% 18% 20% 15%16% 14%15% 15% 11% 11% 11% 8% 10% 0% 1997 1998 1999 2000 2001 2002 2003 2004 2005 2006 2007 2008 2009 2010 2011 2012 2013 2014 2015
Average Soil Nitrate following Wheat in 2015 MB Fall 2015 Samples 52 (lb/a 0-24 samples) 42 49 52 24 49 46 43 38 37 36 43 43 ND 35 34 36 38 33 29 47 MN 41 48 SD 41 55
Average Soil Nitrate Following Wheat 1986 2015 (0-24 lb/a) 120 107 96 100 81 Nitrate-N (0-24 lb/a) 80 68 6459 44545361 6056 60 504648 60 46 29324045 4335 4238 3541 343241 40 20 0 8687888990919293949596979899 0 1 2 3 4 5 6 7 8 9 101112131415
Soil Nitrate Variability Between Fields Following WHEAT in 2015 >100 3% Total Nitrate 0-24" lb/a Nitrate Category 81-100 4% 9% 61-80 41-60 21% 21-40 43% 0-20 20% 0% 10% 20% 30% 40% 50% 60% % of Fields Testing in Each Category
Average Soil Nitrate Following Wheat (1986-2015) Deep N (24-48 lb/a) 70 6359 60 4953 51 444645 50 4341 Nitrate-N (0-24 lb/a) 363432293129 40 29 27 30 13141514141921 201819 1818 20 10 0 8687888990919293949596979899 0 1 2 3 4 5 6 7 8 9 101112131415
Average Soil Nitrate Following Barley 1986 - 2015 110 95 100 84 90 Nitrate-N (0-24 lb/a) 70 80 70 56 5253 3937394753 4045485041 60 4345 50 353529273438332933 3529 30 40 30 20 10 0 8687888990919293949596979899 0 1 2 3 4 5 6 7 8 9 101112131415
Soil Nitrate Variability Between Fields Following Barley in 2015 >100 3% Total Nitrate 0-24" lb/a Nitrate Category 81-100 3% 4% 61-80 41-60 12% 21-40 42% 0-20 36% 0% 10% 20% 30% 40% 50% 60% % of Fields Testing in Each Category
Average Soil Nitrate Following Sunflower 1986 - 2015 101 110 100 82 90 Nitrate-N (0-24 lb/a) 70 80 70 55 4650 434043474447494450485048 50 60 50 39332929 3234 3033252227 40 30 20 10 0 8687888990919293949596979899 0 1 2 3 4 5 6 7 8 9 101112131415
Soil Nitrate Variability Between Fields Following Sunflower in 2015 >100 2% Total Nitrate 0-24" lb/a Nitrate Category 81-100 2% 4% 61-80 41-60 11% 21-40 35% 0-20 46% 0% 20% 40% 60% % of Fields Testing in Each Category
Average Soil Nitrate Following Drybeans 1986 - 2015 102 100 110 100 90 78 72 Nitrate-N (0-24 lb/a) 70 80 66 6561 65 525761 70 5358 535558 444134353839434754 51 60 49 4646 50 40 30 20 10 0 8687888990919293949596979899 0 1 2 3 4 5 6 7 8 9 101112131415
Soil Nitrate Variability Between Fields Following Dry Beans in 2015 >100 6% Total Nitrate 0-24" lb/a Nitrate Category 81-100 6% 16% 61-80 41-60 36% 21-40 33% 0-20 3% 0% 20% 40% 60% 80% % of Fields Testing in Each Category
Average Soil Nitrate Following Sugarbeets 1986 - 2015 110 100 90 Nitrate-N (0-24 lb/a) 80 70 484753 60 50 30221619182520252023252221162121221713151720161617 40 2521 30 20 10 0 86 87 88 89 90 91 92 93 94 95 96 97 98 99 0 1 2 3 4 5 6 7 8 9 10 11 12 13 14 15
Soil Nitrate Variability Between Fields Following Sugarbeet in 2015 >100 0% Total Nitrate 0-24" lb/a Nitrate Category 81-100 0% 1% 61-80 41-60 3% 21-40 20% 0-20 76% 0% 20% 40% 60% 80% % of Fields Testing in Each Category
Average Soil Nitrate Following Fallow 1986 - 2015 143149 160 128 140 119 120 Nitrate-N (0-24 lb/a) 102 98 4858606769798481938579756662595060 100 80 80 65 4956 465546 60 40 20 0 8687888990919293949596979899 0 1 2 3 4 5 6 7 8 9 101112131415
Soil Nitrate Variability Between Fields Following Fallow in 2015 Total Nitrate 0-24" lb/a Nitrate Category >100 9% 9% 81-100 61-80 18% 41-60 29% 21-40 26% 9% 0-20 0% 10% 20% 30% 40% % of Fields Testing in Each Category
Average Soil Nitrate following Soybean in 2015 Fall 2015 samples MB 28 (lb/a 0-24 samples) 27 31 30 33 22 31 36 43 33 27 29 24 33 ND 28 27 27 22 24 28 MN 29 31 SD 44 30 24 39
Average Soil Nitrate Following Soybeans 1995 - 2015 40 35 35 33 313032 35 2930 3028 2729 29 27 30 26 232426 Nitrate-N (0-24 lb/a) 2423 25 21 20 15 10 5 0 95 96 97 98 99 0 1 2 3 4 5 6 7 8 9 10 11 12 13 14 15
Soil Nitrate Variability Between Fields Following Soybeans in 2015 >100 2% Total Nitrate 0-24" lb/a Nitrate Category 81-100 1% 3% 61-80 41-60 10% 21-40 47% 0-20 37% 0% 20% 40% 60% % of Fields Testing in Each Category
Average Soil Nitrate following Corn in 2015 Fall 2015 samples MB (lb/a 0-24 samples) 50 74 69 52 68 51 49 ND 49 57 35 37 60 68 84 63 MN 68 SD 81 33 78
Average Soil Nitrate Following Corn 1997 2015 (Northwood Laboratory) 110 100 90 71677166 Nitrate-N (0-24 lb/a) 70 80 70 59 57 515347 4750 60 4345423739 44 45 50 40 30 20 10 0 97 98 99 0 1 2 3 4 5 6 7 8 9 10 11 12 13 14 15
Soil Nitrate Variability Between Fields Following Corn in 2015 >100 10% Total Nitrate 0-24" lb/a Nitrate Category 81-100 9% 16% 61-80 41-60 25% 21-40 29% 0-20 11% 0% 10% 20% 30% 40% % of Fields Testing in Each Category
% Soil Samples with Phosphorus less than 10 ppm Fall 2015 samples (0-6 samples) (Olsen P test) MB 41% 47% 48% 64% 16% 68% 43% 32% 24% 77%74% 71% 53% 58% 69% ND 47% 56% 54% 50% 66% 37% 71% MN 40% 52% 36% SD 32% 38% 49% 33% 37%
% Soil Samples with Potassium less than 150 ppm MB Fall 2015 samples (0-6 samples) 37% 13% 30% 30% 31% 6% 19% 15% 27% 4% 5% 2% 16% 76% 36% ND 8% 19% 71% 7% 45% 6% 45% 2% 6% 28% MN 34% SD 36% 1% 5% 33% 39%
% Soil Samples with Zinc less than 1.0 ppm MB Fall 2015 samples (0-6 samples) 49% 61% 51% 59% 28% 76% 52% 31% 36% 75% 90% 81% 49% 66% 40% ND 50% 69% 29% 78% 47 58% 24% 77% 44% MN 53% 26% SD 34% 60% 43% 34% 24%
% Soil Samples with Sulfur less than 15 lb/a MB Fall 2015 samples (0-6 samples) 6% 24% 14% 21% 7% 22% 19%20% 56%25% 18% 13% 35% 23% ND 39% 66% 19% 47% 32% 58% 67% 46% MN 75% 35% 58% SD 84%74% 71% 38% 60%
% Soil Samples with %OM less than 3.0% MB Fall 2015 Samples (0-6 samples) 7% 10% 22% 22% 31% 19% 31% 24% 20% 67%44% 34% 22% 21% 33% ND 35% 60% 77% 25% 29% 34% 30% 52% MN 27% 11% 11% SD 23% 30% 5% 28% 7%
% Soil Samples with Chloride less than 40 lb/a MB Fall 2015 Samples (0-24 samples) 38% 66% 56% 56% 22% 54% 47% 39% 54% 87%70% 53% 41% 44% 62% ND 67% 89% 59% 51% 88% 90% 90% 54% MN 63% 78% SD 55% 83% 72%
% Soil Samples with Copper less than 0.5 ppm MB Fall 2015 samples (0-6 samples) 18% 4% 30% 9% 33% 15% 14% 16% 26% 4% 14% 3% 14% 38% 43% ND 13% 51% 10% 27% 18% 13% 27% 16% 7% MN 6% 9% SD 6% 3% 6% 1%
% Soil Samples with Boron less than 0.4 ppm MB Fall 2015 samples (0-6 samples) 1% 1% 3% 7% 8% 1% 10% 13% 3% 4% 7% 15% 9% 23% 9% ND 7% 22% 38% 78% 6% 26% 44% 27% 16% 7% MN 11% SD 7% 21%35% 18% 14%
% Soil Samples with Soil pH greater than 7.3 MB Fall 2015 samples (0-6 samples) 69% 89% 74% 77% 92% 77% 59% 73% 75 66%50% 74% 78% 63% 96% ND 37% 6% 66% 45% 78% 30% 44% 11% 25% MN 41% 58% SD 27% 28% 19% 25% 22%
% Soil Samples with Soil pH less than 6.0 MB Fall 2015 samples (0-6 samples) 2% 0% 5% 4% 0% 1% 17% 4% 2% 3% 1% 6% 3% 7% 1% ND 1% 52% 3% 15% 5% 13% 16% 25% 27% 17% MN 11% 18% SD 29% 36% 21% 13% 39%
% Subsoil Samples with pH less than 7.0 MB Fall 2015 samples (0-6 samples) 2% 0% 5% 3% 0% 1% 15% 2% 3% 1% 1% 1% 2% 1% 0% ND 3% 52% 2% 6% 1% 7% 9% 25% 17% 9% MN 3% 3% SD 29% 23% 10% 6% 19%
% Soil Samples with Carbonate greater than 5.0% MB Fall 2015 samples (0-6 samples) 40% 58% 22% 22% 21% 5% 16% 31% 9% 11 13% 6% 29% 23% 5% ND 5% 4% 11% 28% 6% 3% 0% 1% MN 12% 23% SD 4% 9% 2% 1%
% Soil Samples with Salts greater than 1.0 MB Fall 2015 Samples (0-6 samples) 13% 11% 9% 5% 18% 12% 8% 14% 18% 3% 19% 8% 35% 15% 9% ND 10% 3% 2% 24% 13% 3% 2% 18% MN 9% 4% SD 1% 1% 3% 11% 3%
North Dakota & NW Minnesota % Samples Testing with Salts greater than 1.0 40% 582 Grand Forks 35% 30% 25% 567 TRF 20% 15% 587 Minot 10% 5% 0% 2008 2012 1998 1999 2000 2001 2002 2003 2004 2005 2006 2007 2009 2010 2011 2013 2014 5015 1:1 salt method expressed as mmhos/cm
South Dakota - % Samples Testing with Salts greater than 1.0 40% 35% 30% 25% 20% 15% 10% 5% 0% 572 Watertown 573 Huron 574 Aberdeen 582 Grand Forks 1:1 salt method expressed as mmhos/cm