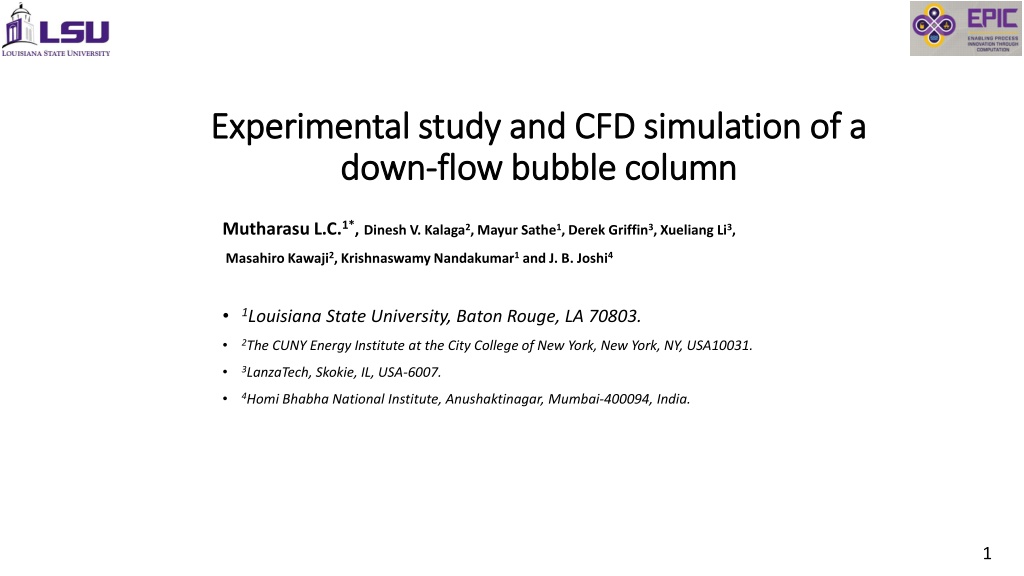
Experimental Study and CFD Simulation of a Down-flow Bubble Column
This study and simulation focus on the experimental setup, measurement techniques, and results of a down-flow bubble column. It explores novel features such as inverted bubbly flow, micro-bubble generation, and gas injection. Detailed analysis includes axial and radial variations of volumetric gas holdup, drag modification, and phase isolation techniques. The integration of experimental data and CFD results enhances the understanding of gas-liquid flow behavior in the bubble column.

Download Presentation

Please find below an Image/Link to download the presentation.
The content on the website is provided AS IS for your information and personal use only. It may not be sold, licensed, or shared on other websites without obtaining consent from the author. Download presentation by click this link. If you encounter any issues during the download, it is possible that the publisher has removed the file from their server.
E N D
Presentation Transcript
Experimental study and CFD simulation of a Experimental study and CFD simulation of a down down- -flow flow bubble column bubble column Mutharasu L.C.1*, Dinesh V. Kalaga2, Mayur Sathe1, Derek Griffin3, Xueliang Li3, Masahiro Kawaji2,KrishnaswamyNandakumar1and J. B. Joshi4 1Louisiana State University, Baton Rouge, LA 70803. 2The CUNY Energy Institute at the City College of New York, New York, NY, USA10031. 3LanzaTech, Skokie, IL, USA-6007. 4Homi Bhabha National Institute, Anushaktinagar, Mumbai-400094, India. 1
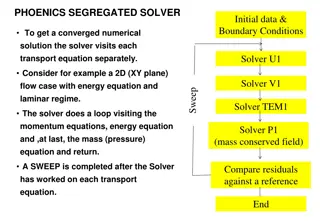
Outline Novel Features of the Down flow Bubble column Experimental setup & Measurement techniques Experimental results CFD setup Drag modification based on a simple force balance CFD results Conclusion 2
Novel Features of the Bubble column Considered Down flow Bubble column Conventional Plunging jet Down flow Bubble column Liquid inlet Orifice Plate 22 cm P1 Gas sparger 50 cm P2 1m 62 cm P3 91 cm 1.5m High speed camera P4 ray source P5 NaI-Detector 1. Inverse Bubbly flow with large cross-section. 30 cm 2. Micro-bubble generation by impinging liquid jets Conventional Plunging Jet Down-flow Bubble column (Majumder et al, 2005) 3. Gas injection. (Roy et al, 2013) Gas- Liquid outlet 3
Experimental Setup Bubble column Measurement Techniques 1. Phase isolation technique (Volumetric gas holdup) 2. Pressure transducer (axial variation of gas holdup) 3. Gamma Ray Densitometry (Radial Variation of gas holdup) 4. High Speed Camera & Boroscope (bubble size) 8 arm gas sparger Gamma Ray Densitometry setup High speed camera images of Micro-bubbles 4
Experimental Results Axial variation of volumetric holdup from Pressure Transducers for VL = 70.17mm/s Volumetric holdup from the Phase Isolation Technique. VG = 2.5 mm/s VG = 10.2 mm/s VG = 17.8 mm/s 0.45 VL = 62.24 mm/s VL = 70.17 mm/s + VL = 78.83 mm/s 0.4 Fractional gas hold-up, G (-) 0.35 0.3 0.25 0.2 0.15 0.1 0.05 0 (P1-P2) (P2-P3) (P3-P4) (P4-P5) (P1-P5) Pressure Transducers 5
Experimental Results Radial variation of the chordal averaged gas holdup from Gamma Ray Densitometry 0.5 0.7 VL = 62.2 mm/s VL = 70.1 mm/s 0.45 0.6 0.4 Fractional gas hold-up, G (-) 0.5 0.35 Fractional gas hold-up, G (-) 0.3 0.4 0.25 0.3 0.2 0.15 0.2 0.1 0.1 0.05 0 0 0 0.2 Dimensionless radial distance, r/R (-) 0.4 0.6 0.8 1 0 0.2 Dimensionless radial distance, r/R (-) 0.4 0.6 0.8 1 VG = 2.5 mm/s VG = 10.1 mm/s VG = 17.8 mm/s. 6
Experimental Results Radial variation of the chordal averaged gas holdup from Gamma Ray Densitometry 0.4 VL = 78.3 mm/s 0.35 Fractional gas hold-up, G (-) 0.3 0.25 0.2 0.15 0.1 0.05 0 0 0.2 0.4 0.6 0.8 1 Dimensionless radial distance, r/R (-) VG = 2.5 mm/s VG = 10.1 mm/s VG = 17.8 mm/s. 7
Experimental Results Radial variation of mean Bubble size 100 cm below Orifice plate 1000 1000 VL=62.24 mm/s VL =70.1 mm/s 900 900 800 800 Bubble diameter, dB ( m) 700 700 Bubble diameter, dB ( m) 600 600 500 500 400 400 300 300 200 200 100 100 0 0 0.0 0.2 0.4 0.6 0.8 1.0 0.0 0.2 0.4 0.6 0.8 1.0 Dimensionless radius, r/R (-) Dimensionless radius, r/R (-) VG = 2.5 mm/s , VG = 10.2 mm/s, VG = 17.8 mm/s. 8
Experimental Results Radial variation of mean Bubble size 100 cm below Orifice plate 1000 VL =78.83 mm/s 900 800 700 Bubble diameter, dB ( m) 600 500 400 300 200 100 0 0.0 0.2 0.4 0.6 0.8 1.0 Dimensionless radius, r/R (-) VG = 2.5 mm/s , VG = 10.2 mm/s, VG = 17.8 mm/s. 9
Multiphase CFD Models EULER EULER MODEL FLOW INFORMATION EULER LAGRANGE MODEL SIMPLICITY VOLUME OF FLUID LEVEL SET DIRECT NUMERICAL SIMULATION Euler Euler model provides necessary flow information with least computational requirement. 10
Eulerian-Eulerian framework Continuity Equations: Continuity Equations: ? ? ?? ???? + ?. ???? ?? = ??? ??? ?=1 Fluid Fluid- -Fluid Momentum Equations: Fluid Momentum Equations: ? ?????? ?? + ?. ???? ?? ??= ???? + ?. ??+ ???? ? + ?=1 + ?????,?+ ??+ ?????,?+ ???,?+ ???,?+ ???,? ? ??? ??? ??? ??? 11
Turbulence Modelling Mixture Mixture K K- - epsilon model epsilon model K - equation ? ?? ??,? ?? ??? + ?. ??? ?? = ?. ?? + ??? ??? Epsilon - equation ? ????? + ?. ??? ?? = ?. ??,? ?? ?? +? ?1???? ?2???? ? ? ?? = ?=1 Where: ?? ?? ?? ???? ?=1 ?? ?? ? ?=1 ?? = ? ??,? = ?? ?? ?2 ??,? = ??,? ? ??+ ?? ? ? : ? ?? 12
Interfacial force modelling Drag Force : Schiller Naumann Lift Force: 0.687 ??,?? = ??,?? 24 1 + 0.15 ???? ?????= ???????? ?? ? ?? ,??= 0.2 , ????< 1000 ???? 0.44 , ???? 1000 0.687 24 1 + 0.15 ???? ???? 0.44 , ????< 1000 ??,?? = ??,?? , ???? 1000 Turbulent Dispersion Force: Virtual Mass Force : ? ???? ?? , ???= 0.5 ???,?= ??? ?? ? ???, ???= 0.2 ???= ??????? 13
Source point modelling Modelling of Jets as source points Mesh Cells marked for Source point modelling Orifice plate design Orifice diameter = 400 m Triangular pitch = 3 mm 14
Source point modelling Large Bubble to Micro-bubble breakage modelling Modelling of Gas sparger as source points Liquid inlet 8 arm gas sparger Cells marked for Source point modelling Micro bubble phase Source & Large bubble phase sink (cell layer) FLUENT- UDF Gas sparger inlet (cells) Large bubble pahse source 15 Pressure outlet
Drag modification from force balance Experimental Average Slip Velocity Slip Velocity (Simple Force Balance) VG (mm/s) VL (mm/s) Gas holdup (-) 2.54 62.24 10.1 62.24 17.8 62.24 2.54 70.17 10.1 70.17 17.8 70.17 2.54 78.83 10.1 78.83 17.8 78.83 ?? 8?????? ?? (?? ?? 0.96 0.84 0.71 0.96 0.86 0.75 0.97 0.87 0.77 ?????= ?? ?? = ?? ? (?? ?? 4?? 3???? ?? ?? ?? ?? ????= ? ?? ?? ?? ?? ?? ?????= ?? 16
Drag modification from force balance With no Drag modification ?? = 1 160 Average slip velocity from force balance, ?? fb (mm/s) 140 120 100 80 60 40 40 50 60 70 80 90 100 110 Experimental average slip velocity ?????(mm/s) 17
Drag modification from force balance With optimum ?? values 160 Drag model Df Average slip velocity from force balance, ?? fb (mm/s) 140 Schiller and Naumann (1935) 1.28 Dalla Ville (1948) 1.14 Clift et al. (2005) 1.28 120 Ma and Ahmadi (1990) 1.42 Mei et al. (1994) 2.96 100 2.94 La n et al. (2002) Tomiyama et al. (1998) 1.24 80 Tomiyama (2004) 1.38 Zhang and VanderHeyden (2002) 1.18 60 40 40 50 60 70 80 90 100 110 Experimental average slip velocity ?????(mm/s) 18
CFD Results Contours for VG=17.8 mm/s and VL=62.2 mm/s. 19
CFD Results (Radial gas holdup) 0.7 0.5 VL=62.24 mm/s VL=70.1 mm/s 0.45 0.6 0.4 Fractional gas hold-up, G (-) Fractional gas hold-up, G (-) 0.5 0.35 0.3 0.4 0.25 0.3 0.2 0.15 0.2 0.1 0.1 0.05 0 0 0 0.2 Dimensionless radial distance, r/R (-) 0.4 0.6 0.8 1 0 0.2 0.4 0.6 0.8 1 Dimensionless radial distance, r/R (-) VG = 2.5 mm/s (exp) VG = 10.2 mm/s (exp) VG = 17.8 mm/s(exp) - - VG = 2.5 mm/s (CFD) - - VG = 10.2 mm/s (CFD) - - VG = 17.8 mm/s(CFD) 20
CFD Results (Radial gas holdup) 0.4 VL= 78.83 mm/s 0.35 0.3 Fractional gas hold-up, G (-) 0.25 0.2 0.15 0.1 0.05 0 0 0.2 0.4 0.6 0.8 1 Dimensionless radial distance, r/R (-) VG = 2.5 mm/s (exp) VG = 10.2 mm/s (exp) VG = 17.8 mm/s(exp). - - VG = 2.5 mm/s (CFD) - - VG = 10.2 mm/s (CFD) - - VG = 17.8 mm/s(CFD). 21
CFD Results (Radial Liquid velocity) 0.1 0.1 VL=62.24 mm/s VL=70.1 mm/s 0.05 0.05 Interstitial liquid axial velocity, ?z L (m/s) Interstitial liquid axial velocity, ?z L (m/s) 0 0 -0.05 -0.05 -0.1 -0.1 -0.15 -0.15 -0.2 - - VG = 2.5 mm/s (CFD) - - VG = 2.5 mm/s (CFD) -0.2 -0.25 - - VG = 10.2 mm/s (CFD) - - VG = 10.2 mm/s (CFD) -0.3 -0.25 - - VG = 17.8 mm/s(CFD) - -VG = 17.8 mm/s(CFD) -0.35 -0.3 0 0.2 0.4 0.6 0.8 1 0 0.2 0.4 0.6 0.8 1 Dimensionless radial distance, r/R (-) Dimensionless radial distance, r/R (-) 22
CFD Results (Radial gas holdup) 0.05 VL=78.83 mm/s 0 Interstitial liquid axial velocity, ?z L (m/s) -0.05 -0.1 -0.15 -0.2 - - VG = 2.5 mm/s (CFD) -0.25 - - VG = 10.2 mm/s (CFD) -0.3 - - VG = 17.8 mm/s(CFD) -0.35 0 0.2 0.4 0.6 0.8 1 Dimensionless radial distance, r/R (-) 23
Conclusions Inverse bubbly flow with microbubbles was achieved in a column of large cross-section (30 cm). The observed Gas-holdup profiles indicated a homogenous regime. Recirculation were observed (from CFD) only in Extreme operating conditions The observed circulation is not buoyancy driven. 24
Thank you ! Questions ? Questions ? 25


")
")
")
")