Advanced Simulation Techniques for Analyzing Samples with Complex Geometries
Explore the capabilities of PENELOPE simulation software for analyzing samples with intricate structures like particles, inclusions, multilayers, lamellae, and phase boundaries. The software facilitates detailed investigations of material composition and electron-photon transport in diverse geometries. Running simulations with PYPENELOPE offers a user-friendly interface with features for defining electron beam characteristics, sample geometries, material compounds, and simulation parameters for precise analysis. Enhance your understanding of sample properties through advanced simulation techniques.

Uploaded on Sep 28, 2024 | 0 Views
Download Presentation

Please find below an Image/Link to download the presentation.
The content on the website is provided AS IS for your information and personal use only. It may not be sold, licensed, or shared on other websites without obtaining consent from the author. Download presentation by click this link. If you encounter any issues during the download, it is possible that the publisher has removed the file from their server.
E N D
Presentation Transcript
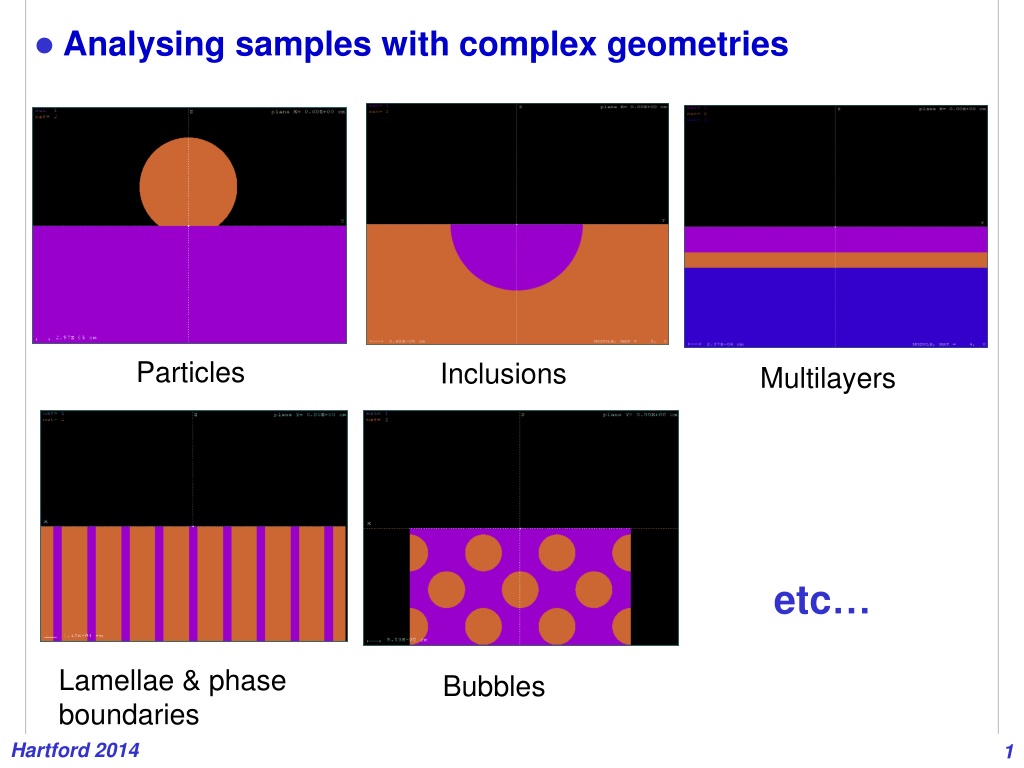
Analysing samples with complex geometries Particles Inclusions Multilayers etc Lamellae & phase boundaries Hartford 2014 Bubbles 1
The simulation code PENELOPE Salvat et al. (1996 2014) PENetration and Energy LOss of Positrons and Electrons (... and photons) General-purpose Monte Carlo subroutine package for the simulation of coupled electron-photon transport in arbitrary geometries (75 eV 1 GeV) Developed and maintained at the UB. Distributed by the OECD-NEA Data Bank (Paris) http://www.nea.fr/lists/penelope.html PENEPMA: EPMA simulations made easy Based on PENELOPE. Latest version v. 2014 You can define the energy, direction and position of the electron beam The geometry of the sample (and its environment) is defined by using PENGEOM Provides the x-ray spectrum at different photon detectors Hartford 2014 2
Running PENEPMA with PYPENELOPE (v. 2011) Interface created by Philippe Pinard http://pypenelope.sourceforge.net Hartford 2014 3
Running PENEPMA with PYPENELOPE Defining a new simulation Starting a new simulation Hartford 2014 4
Running PENEPMA with PYPENELOPE Simulation s folder & title Hartford 2014 5
Running PENEPMA with PYPENELOPE Incident electron beam characteristics Hartford 2014 6
Running PENEPMA with PYPENELOPE Sample geometry: bulk, multilayer, inclusion, grain boundaries Hartford 2014 7
Running PENEPMA with PYPENELOPE Material compounds can be defined by means of their chemical formula Hartford 2014 8
Running PENEPMA with PYPENELOPE or by clicking each element in the periodic table Hartford 2014 9
Running PENEPMA with PYPENELOPE Simulation parameters related to the mixed simulation algorithm of PENELOPE: Eabs (electrons & photons), C1, C2, WCC, WCR Hartford 2014 10
Running PENEPMA with PYPENELOPE Interaction forcing values for each interaction mechanism e.g. ionization & bremsstrahlung emission Hartford 2014 11
Running PENEPMA with PYPENELOPE Different kind of photon detectors can be defined Hartford 2014 12
Running PENEPMA with PYPENELOPE A simulation will stop if the number of showers, simulation time or uncertainty on a specific X-ray line is reached Hartford 2014 13
Running PENEPMA with PYPENELOPE Running the defined simulation Hartford 2014 14
Running PENEPMA with PYPENELOPE Characteristic X-ray intensities (primary, fluorescence characteristic, fluorescence bremss, total) and statistical uncertainties Hartford 2014 15
Running PENEPMA with PYPENELOPE Results can be visualized on-line or exported to data files Hartford 2014 16
Running PENEPMA manually To run PENEPMA manually we usually must prepare: Geometry definition file (PENGEOM) The corresponding material-data files (by running the program material) The input file containing details on the electron beam, simulation parameters, detectors, variance reduction, methods and spatial distribution of x-ray events, simulation time or number of trajectories, etc Advantages of running PENEPMA manually: Parallel processing possible (v. 2014) Any geometry can be defined (sample, microscope, etc..) 2D distributions of X-ray emission can be obtained Scripts prepared to visualize output results using gnuplot Hartford 2014 17
Preparing the input file Hartford 2014 18
Preparing the input file Hartford 2014 19
Preparing the input file Hartford 2014 20
Example: Ca4Al4MgO11inclusion on Fe z E = 15 keV electron beam (y = 1 m, x = 0 m) y Ca4Al4MgO11 r = 2 m Fe Hartford 2014 21
Results: characteristic x-ray spectrum O Si Mg Ca Fe Hartford 2014 22
Results: EPMA spectrum Si O Ca Mg Fe Hartford 2014 23
Results: depth distribution of X-ray emission (Fe K ) Hartford 2014 24
Fe K Hartford 2014 25
Fe K Hartford 2014 26
Fe K Hartford 2014 27
Fe K Hartford 2014 28


")