Evaluation of Precipitation Forecasts Using OLYMPEX Data
This research evaluates model physics, specifically microphysics and boundary-layer schemes, using data from the OLYMPEX workshop in 2015. The study focuses on known deficiencies in microphysics schemes such as variability in location and amount for precipitation. Evaluations were conducted for cases during November 12-15 and November 16-19, 2015, analyzing atmospheric river events and modeling at different resolutions using WRF-ARW v.3.7.1. The analysis includes comparisons of windward vs. leeward slopes and highlights the resolution dependence of microphysics versus PBL schemes.
Download Presentation

Please find below an Image/Link to download the presentation.
The content on the website is provided AS IS for your information and personal use only. It may not be sold, licensed, or shared on other websites without obtaining consent from the author.If you encounter any issues during the download, it is possible that the publisher has removed the file from their server.
You are allowed to download the files provided on this website for personal or commercial use, subject to the condition that they are used lawfully. All files are the property of their respective owners.
The content on the website is provided AS IS for your information and personal use only. It may not be sold, licensed, or shared on other websites without obtaining consent from the author.
E N D
Presentation Transcript
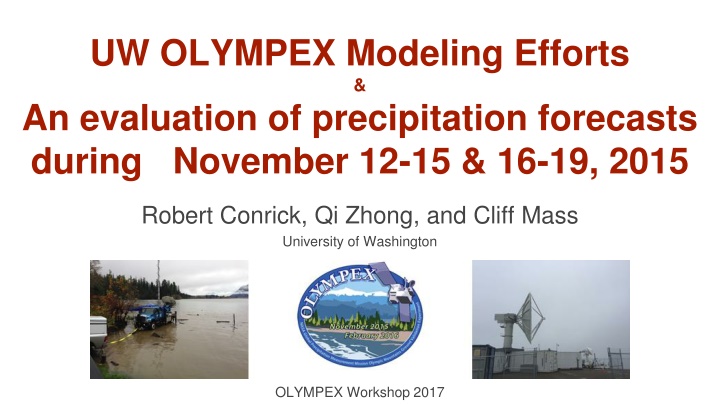
UW OLYMPEX Modeling Efforts & An evaluation of precipitation forecasts during November 12-15 & 16-19, 2015 Robert Conrick, Qi Zhong, and Cliff Mass University of Washington OLYMPEX Workshop 2017
What are our goals? To evaluate model physics using data from OLYMPEX. Specifically, we want to evaluate: Microphysics schemes Boundary-layer schemes
Why evaluate model physics? WRF has: 22 microphysics (MP) schemes 13 boundary-layer (PBL) schemes What problems exist in schemes?
Which microphysics deficiencies are known? Variability in location and amount for microphysical species and precipitation Ice and snow representations - Many schemes still use spherical snow. Riming and graupel - Most schemes have ice as discrete catagories Photo credit: NOAA NSSL
Cases: November 12-15, 2015 November 16-19, 2015 Atmospheric river events, producing over 400 mm of precipitation in some areas. Divided into periods, i.e. prefrontal, warm sector, postfrontal, etc. Modeled at 36-12-4-1.33 km resolutions using the WRF-ARW v.3.7.1
Cases: November 12-15, 2015 November 16-19, 2015 Nov. 12 - 15: Goddard, Milbrandt 2-mom., SBU-YLin, Thompson, WSM5, WSM6, WDM5 Future/In progress: Morrison 2-mom., P3, NSSL 2-mom. Nov. 16 - 19: Goddard, Milbrandt 2-mom., SBU-YLin, Thompson, WSM5, WSM6 Future/In progress: Morrison 2-mom., P3, NSSL 2-mom.
Olympic Mountains: Windward vs. Leeward Underforecasting precipitation is common on both windward and leeward slopes. Nov 12-15 has worse windward than leeward forecasts; Nov 16-19 is opposite. Percent of Observed Percent of Observed Nov 12-15 Nov 16-19
Olympic Mountains: Windward vs. Leeward Microphysics (MP) shows less resolution dependence than PBL. Nov 12-15 Percent of Observed Percent of Observed credit: Qi Zhong Microphysics PBL (YSU PBL) (Thompson MP)
Quinault Area Forecasts SW-NE transect up the Quinault Goals: Do precipitation forecasts differ as the flow is modified by terrain? Is pre- and post-frontal forecast accuracy different?
How do precip. forecasts change going inland? MP Nov. 12-15 MP Nov. 16-19
How do precip. forecasts change going inland? MP Nov. 12-15 PBL Nov. 12-15
Quinault Area Forecasts: Rain rates MP Nov. 12-15
Quinault Area Forecasts: Rain rates MP Similar results for: Nov. 12-15 - Nov. 16-19 - PBL tests
Are synoptic differences responsible? Melting levels and wind speed/direction do not substantially differ by MP or PBL scheme. Beach Height (m; agl) Speed (m/s) Bishop Nov. 16-19
Are differing microphysical species responsible? Hypotheses: 1. Different schemes produce different amounts of species and hydrometeors, which influences precipitation forecasts. 2. Timescales of model microphysics differ from reality. How will we test this? Compare WRF DSDs with disdrometer observations along the Quinault and elsewhere. Compare WRF microphysical output to Citation data. Compare WRF microphysical output to dual-pol radar products.
Are differing microphysical species responsible? Cloud Ice Mixing Ratio Total Mixing Ratio Snow Mixing Ratio 0000 UTC Nov 13
Future Work Expand cases to include different types of weather systems. - Dec. 1-4 & Dec. 8-9 Compare WRF DSDs with disdrometer observations along the Quinault and elsewhere. Compare WRF microphysical output to Citation data. Compare WRF microphysical output to dual-pol radar products.
Conclusions Underforecasting precipitation is a problem, especially on windward slopes where observed precipitation is high. - No resolution dependence when varying MP schemes. - Varying PBL schemes shows strong resolution dependence. In the Quinault region, sensitivity to partitioning of MP species yields very poor forecasts.
Extra Slides - Resolution - Elevation
Does resolution improve forecast accuracy? Increasing resolution improves precipitation forecasts in PNW. - We ll revisit this in a few slides. Nov. 01, 2015 Feb. 01, 2016 36 km 1.3 km
Does elevation control forecast accuracy? Nov. 16-19 Percent of Observed Percent of Observed Nov. 12-15
