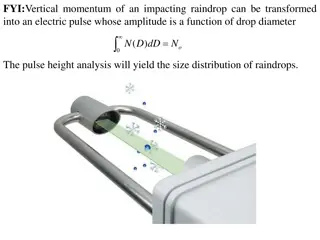
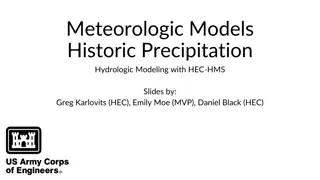
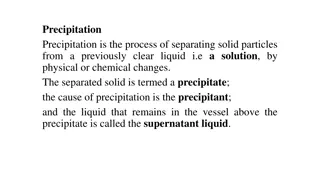
Insights into Precipitation Analysis for Transportation Applications
Delve into the utilization of precipitation data by state transportation agencies for road and bridge design, safety operations, and traveler information. Explore model components and the nature of precipitation events, along with challenges associated with spatial scale sampling. Discover the importance of understanding spatial and temporal aspects of precipitation for effective transportation planning and operations.
Download Presentation

Please find below an Image/Link to download the presentation.
The content on the website is provided AS IS for your information and personal use only. It may not be sold, licensed, or shared on other websites without obtaining consent from the author.If you encounter any issues during the download, it is possible that the publisher has removed the file from their server.
You are allowed to download the files provided on this website for personal or commercial use, subject to the condition that they are used lawfully. All files are the property of their respective owners.
The content on the website is provided AS IS for your information and personal use only. It may not be sold, licensed, or shared on other websites without obtaining consent from the author.
E N D
Presentation Transcript
The Spatial and Temporal Aspects of Precipitation Applied to Transportation Applications James E. Mitchell, Ph.D. IT Statewide Project Officer-GIS presented at the NASA GPM-ACCP Transportation and Logistics Workshop Virtual Conference November 2, 4, 5; 2020
Uses of Precipitation Data by State Transportation Agencies Road and Bridge Design Static/Historical/Archival Identify Design Storm Calculate Probable Maximum Precipitation Event Operations Near-Real Time/Short-term Forecast 511 Traveler Information Roadway Conditions Safety Static/Historical/Archival
Model Components q = f(x, y, z, p, t) + Where: q = Output f() = Model of known relationship(s) between inputs and outputs x, y, z = Input Watershed Characteristics p = Incident Precipitation t = Input Time Dimension = Error Unexplained behavior and Intrinsic variability
Intrinsic Variability is a Watershed Characteristic Same mode (slope and intercept), different uncertainty (variance). Model variability is a characteristic of the watershed, Fundamental hhydrology is consistent across basins. Spatial patterns of basin characteristics modify response.
Nature of Precipitation Events A What You See and What You Get A - GOES Satellite Image B - Doppler Radar Image C - NWS Precipitation Forecast B Precipitation occurs as saltatory events that track across the landscape, along paths that follow frontal boundaries, tropical cyclones, and other weather phenomena. They are discontinuous, anisotropic, and inhomogeneous. Figures A and B show these characteristics for November 1, 2020:10:40 AM CST . Figure C displays a typical National Weather Service forecast for that same time. The NWS forecast uses a contouring algorithm to represent precipitation. However, contouring assumes relatively well-behaved, smooth, continuous surface and does not represent surfaces with discontinuities, very well. C
Issues of Spatial Scale Sampling Areal Density of Sample Locations Pattern of Rainfall (size of storm, movement across basin) Analysis and Visualization Interpolating Between Sample Locations Maintaining Discontinuities
Issues of Temporal Scale Sampling Frequency of Sample (annual, monthly, daily, hourly ) Cumulative or Instantaneous Intensity of Rainfall Events (Volume/Time) Duration of Rainfall Events Latency, Time Between Events, Training
Traditional Methods to Estimate Precipitation on a Watershed
Spatial Scale - Fixed Watershed Different Sized Data Grids Grid size = 20 (n = 6), Grid size = 10 (n = 17), Grid size = 5 (n = 52)
Spatial Scale - Fixed Data Grid Different Sized Watersheds Grid size = 5; Watershed sizes: A, 2A, 4A
Conclusions Both Spatial and Temporal Domains are Important to Determine: Volume of Precipitation Intensity of Precipitation Relative Scale Between the Data Sample, Rainfall Pattern, and Watershed matters Operational Applications in Transportation Require: Near-Real-Time for 511 Traveler Information Short-term Forecasts for: Roadway Condition Roadway Safety Potential Flooding, Landslides, Infrastructure Integrity Information Needs to be Delivered Through Fast and Efficient, Geospatial Web Services
For More Information Contact James E. Mitchell, Ph. D. Louisiana Office of Technology Services - GIS jim.mitchell@la.gov 225-379-1881
