Precipitation: Forms and Types Explained

Module: 1
Precipitation
Subject
Subject Code
Hydrology & Irrigation Engg 15CV73
Name of the Faculty
SHASHI PRASAD N
Dept. of Civil Engg
K S SCHOOL OF ENGG & Management
PRECIPITATION
It is defined as any form
of moisture reaching the
earth’s surface from the
atmosphere
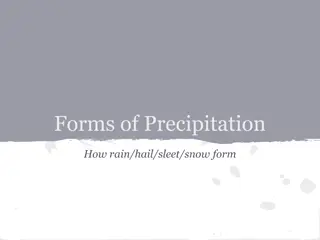
FORMS OF PRECIPITATION
The various forms of
precipitation are:
1.
Rain:
It is used to
describe the precipitation
in the form 0f water
droplets of sizes larger
than 0.5mm.
2.
The maximum size of
the rain drop is 6mm
FORMS OF PRECIPITATION
2.
Snow:
It consist of ice
crystals which is
usually combine to
form flakes.
Its initial density varies
from 0.06 to 0.15 kg/cm3
The average density is
about 0.1 g/cm3
FORMS OF PRECIPITATION
Drizzle:
it is a fine
sprinkle of numerous
water droplets of size less
than 0.5mm.
Its intensity is less than
1mm/hr.
The drops are so small that
they appear to float in the
air
FORMS OF PRECIPITATION
Glaze:
when rain or
drizzle comes in contact
with cold ground at around
0 degree Celsius, the water
drops freeze to form an ice
coating
FORMS OF PRECIPITATION
Sleet:
it is an frozen rain
drops of transparent grains
which form when rainfalls
through air at sub freezing
temperature
FORMS OF PRECIPITATION
Hail:
it forms in the form
of irregular pellets or
lumps of size more than
8mm.
This usually occur in
violent thunderstorms in
which vertical currents are
strong
TYPES OF PRECIPITATION
Cyclonic
precipitation
Orographic
precipitation
Convection
precipitation
TYPES OF PRECIPITATION
1. Cyclonic Precipitation:
It is a large low pressure
region with circular wind
motion.
There are two types in
cyclonic precipitation:
1.
Tropical Cyclones
2.
Extra-Tropical
Cyclones
TROPICAL CYCLONES
It is a wind system with an
intensely strong depression
with MSL pressures,
sometimes below 915m bars.
The normal area extent of a
cyclone is about 100-200
Km in diameter.
The isobars are closely
spaced and the winds are in
anticlockwise in the northern
hemisphere
TROPICAL CYCLONES
The centre of the storm is
called eye which can extend
about 10-50km in diameter.
The wind speed gradually
decreases towards the outer
edge.
The right outside the eye,
very strong winds/reaching
as much as 200kmph
The pressure also increases
outwards.
TROPICAL CYCLONES
The centre of the storm is
called eye which can extend
about 10-50km in diameter.
The wind speed gradually
decreases towards the outer
edge.
The right outside the eye,
very strong winds/reaching
as much as 200kmph
The pressure also increases
outwards.
TROPICAL CYCLONES
The rainfall will
normally be heavy in
entire area occupied by
the cyclone.
This cyclone causes
heavy damage to the life
and property on their
land path and intense
rainfall and heavy floods
in the streams are its
usual consequences
EXTRA-TROPICAL CYCLONE
These are formed in location
outside the tropical zone.
They posses a strong counter
clockwise wind circulation
in the northern hemisphere.
The magnitude of
precipitation and wind
velocities are relatively
lower than these of a tropical
cyclones
The duration of this type is
usually longer and the area
extent also is larger
CONVECTIVE PRECIPITATION
A packet of air which is
warmer than the surrounding
air due to the localized heating
rises because of its lesser
density.
Air from the cooler
surroundings flows to take up
its place thus setting up a
convective cell.
The warmer air continues to
rise, undergoes cooling and
resulting in precipitation
The area extent off such rains is
small being limited to a
diameter of about 10km.
OROGRAPHIC PRECIPITATION
The moist air masses get
lifted up to higher altitudes
due to the presence of
mountains barriers and
consequently undergo
cooling, condensation and
precipitation.
In the mountain ranges, the
windward slopes have heavy
precipitation and the lee
ward slopes light rainfall
SYMON’S RAIN GUAGES
It is the non-recording
rain guages.
It essential consists of a
circular collecting area of
12.7 cm in diameter
connected to the funnel.
The rim of the collector
is set in a horizontal
plane at a height of
30.5cm above the
ground level.
SYMON’S RAIN GUAGES
The funnel discharges the
rainfall, catch into a
receiving vessel.
The funnel and the receiving
vessels are housed in a
metallic container.
Water contained in the
receiving vessel is measured
by a suitably graduated
measuring glass with an
accuracy up to 0.1mm.
SYMON’S RAIN GUAGES
The rainfall is measured
everyday at 8.30 am and is
recorded as the rainfall in a
day.
The receiving bottle
normally does not hold more
than 10cm of the rain.
Proper care must be taken in
maintenance and inspections
of the rainguages.
SYPHON’S RAINGUAGES
This is the recording type
of rain guages. It is also
called as float type rain
guages.
It uses the siphon
mechanism to empty the
rain water collected in the
float chamber.
Rain water entering the
guage at the top is led into
the float chamber through
a funnel and filter
SYPHON’S RAINGUAGES
The filter is provided to
prevent the dust and other
particles .
The float chart consist of
the float with a vertical
stem protruding outside to
the top of which pen is
mounted.
This pen rest on a chart
secured around a clock
driven drum.
SYPHON’S RAINGUAGES
There is a small
compartment by the side of
the float chamber which is
connected to the float
chamber through a small
opening at the bottom.
This is called as siphon
chamber which houses the
small vertical pipe.
This pipe with the bottom
end open and the top end
almost touching the top of
the chamber.
SYPHON’S RAINGUAGES
During the rain water is
collected in the float
chamber raises the water
surface in it and along
with the water surface the
float also rises enabling
the pen to a make a trace
of cumulative depth of
rainfall on the chart
https://www.youtube.com/watch?v=m_ALjsA1Als
https://www.youtube.com/watch?v=PbdNB6XlQKc
OPTIMUM NUMBER OF RAIN-
GUAGE STATIONS
The selected area of a
rain guage is very small
compared to the areal
extent of a storm.
To get a actual
representative of rain
over a catchment area
the number of rain-
guages should be large as
possible.
OPTIMUM NUMBER OF RAIN-
GUAGE STATIONS
The world meteorological organization recommends the
following densities
In Flat regions of temperate, Mediterranean and tropical zones:
1.
Ideal – 1 station for 600-900 km2.
2.
Acceptable: 1 station for 900-3000 km2
In mountain region of temperate, Mediterranean and tropical
zones:
1.
Ideal – 1 station for 100-250 km2.
2.
Acceptable: 1 station for 250-1000 km2
In arid and polar zones 1 station for 1500-10000 km2
depending upon the feasibility.
OPTIMUM NUMBER OF RAIN-
GUAGE STATIONS
From practical considerations of Indian conditions, the
Indian Standards recommends the following densities
as sufficient
In Plains – 1 station for 520km2.
In region of average elevation of 1000m – 1 station per
260-390 km2.
In predominantly hilly areas with heavy rainfall- 1
station per 130km2
CONSISTENCY OF RAINFALL DATA
It is a technique for checking for inconsistency of a
record.
The causes for the inconsistency of a record is due to:
1.
Shifting of a rain-guage to a new location.
2.
The neighbour-hood of the station undergoing a
marked change.
3.
Change in ecosystem due to calamities such as
landslides etc.
4.
Occurrence of observational error from a certain data
DOUBLE MASS CURVE
A group of 5 to 10 base stations in the neighbour-hood
of the problem ‘X’ station is selected.
The data of the annual rainfall of the station ‘X’ and
also the average rainfall of the group of the base station
covering for a long period is arranged in the reverse
chronological order.
The accumulated precipitation of the station
ƩPx and
the accumulated values of the average of the group of
base station ƩPav is calculated starting from the latest
record.
DOUBLE MASS CURVE
Values of ƩPx are plotted
against ƩPav for the various
consecutive time periods.
A decided break in the slope
of the resulting plot indicates
a change in precipitation
regime of a station ‘X’.
The precipitation values at
station ‘X’ beyond the period
of change of regime is
corrected by using the
relation
Pxc =Px * (Me/Ma)
COMPUTATION OF MEAN RAINFALL
There are three methods to calculate the mean rainfall.
They are:
1.
Arithmetical Mean Method.
2.
Thiessen- Mean Method.
3.
Isohyetal Method.
Arithmetical Mean Method.
When the rainfall
measured at various
stations in a catchment
show little variation, the
average precipitation
over the catchment area
is taken as arithmetical
Mean Method..
THIESSEN MEAN METHOD
In this method the rainfall recorded at each station
is given a weightage on the basis of an area closet to
the station.
ISOHYETAL METHOD
It is the line joining points
of equal rainfall
magnitude.
PRESENTATION OF PRECIPITATION
DATA – MOVING AVERAGE CURVE
It is a technique for
smoothening out the high
frequency fluctuations of a
time series and to enable
the trends, if any noticed.
This technique can be
applied to other
hydrological parameters
such as temperature, wind
etc.
PRESENTATION OF PRECIPITATION
DATA – MASS CURVE
It is a plot of the
accumulated precipitation
against the time plotted in
chronological order.
Records obtained from the
float type and weighing
bucket type guages are of
this form.
It is very useful in extracting
the information on the
duration and magnitude of
the storm.
PRESENTATION OF PRECIPITATION
DATA – HYETOGRAPH
It is the plot of the
intensity of rainfall against
the time interval.
It is derived from the mass
curve and is usually
represented as a bar chart.
It represents the total
precipitation received in
the period.
The time intervals
depends on the purpose
required.
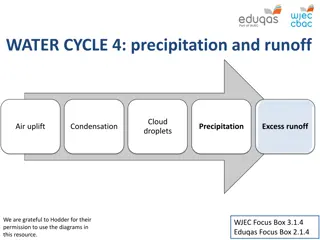
Precipitation, any form of moisture reaching Earth's surface from the atmosphere, encompasses various types like rain, snow, drizzle, glaze, sleet, and hail. Each type has unique characteristics, densities, and formation processes. Additionally, precipitation can be classified into convection, cyclonic, and orographic types based on its origin and cause. Learning about the different forms and types of precipitation is crucial for understanding weather patterns and their impact on the environment.

Download Presentation

Please find below an Image/Link to download the presentation.
The content on the website is provided AS IS for your information and personal use only. It may not be sold, licensed, or shared on other websites without obtaining consent from the author.If you encounter any issues during the download, it is possible that the publisher has removed the file from their server.
You are allowed to download the files provided on this website for personal or commercial use, subject to the condition that they are used lawfully. All files are the property of their respective owners.
The content on the website is provided AS IS for your information and personal use only. It may not be sold, licensed, or shared on other websites without obtaining consent from the author.
E N D
Presentation Transcript
Module: 1 Precipitation Subject Hydrology & Irrigation Engg Subject Code 15CV73 Name of the Faculty SHASHI PRASAD N Dept. of Civil Engg K S SCHOOL OF ENGG & Management
PRECIPITATION PRECIPITATION It is defined as any form of moisture reaching the earth s surface from the atmosphere
FORMS OF PRECIPITATION The various forms of precipitation are: 1. Rain: It describe the precipitation in the form 0f water droplets of sizes larger than 0.5mm. 2. The maximum size of the rain drop is 6mm is used to
FORMS OF PRECIPITATION 2. Snow: It consist of ice crystals which is usually combine to form flakes. Its initial density varies from 0.06 to 0.15 kg/cm3 The average density is about 0.1 g/cm3
FORMS OF PRECIPITATION Drizzle: it is a fine sprinkle of numerous water droplets of size less than 0.5mm. Its intensity is less than 1mm/hr. The drops are so small that they appear to float in the air
FORMS OF PRECIPITATION Glaze: when rain or drizzle comes in contact with cold ground at around 0 degree Celsius, the water drops freeze to form an ice coating
FORMS OF PRECIPITATION Sleet: it is an frozen rain drops of transparent grains which form when rainfalls through air at sub freezing temperature
FORMS OF PRECIPITATION Hail: it forms in the form of irregular pellets or lumps of size more than 8mm. This usually occur in violent thunderstorms in which vertical currents are strong
TYPES OF PRECIPITATION Convection precipitation Cyclonic precipitation Orographic precipitation
TYPES OF PRECIPITATION 1. Cyclonic Precipitation: It is a large low pressure region with circular wind motion. There are two types in cyclonic precipitation: Tropical Cyclones 2. Extra-Tropical Cyclones 1.
TROPICAL CYCLONES It is a wind system with an intensely strong depression with MSL pressures, sometimes below 915m bars. The normal area extent of a cyclone is about 100-200 Km in diameter. The isobars are closely spaced and the winds are in anticlockwise in the northern hemisphere
TROPICAL CYCLONES The centre of the storm is called eye which can extend about 10-50km in diameter. The wind speed gradually decreases towards the outer edge. The right outside the eye, very strong winds/reaching as much as 200kmph The pressure also increases outwards.
TROPICAL CYCLONES The centre of the storm is called eye which can extend about 10-50km in diameter. The wind speed gradually decreases towards the outer edge. The right outside the eye, very strong winds/reaching as much as 200kmph The pressure also increases outwards.
TROPICAL CYCLONES rainfall will normally be heavy in entire area occupied by the cyclone. This cyclone causes heavy damage to the life and property on their land path and intense rainfall and heavy floods in the streams are its usual consequences The
EXTRA-TROPICAL CYCLONE These are formed in location outside the tropical zone. They posses a strong counter clockwise wind circulation in the northern hemisphere. The magnitude of precipitation and wind velocities are relatively lower than these of a tropical cyclones The duration of this type is usually longer and the area extent also is larger
CONVECTIVE PRECIPITATION A packet of air which is warmer than the surrounding air due to the localized heating rises because of its lesser density. Air from the cooler surroundings flows to take up its place thus setting up a convective cell. The warmer air continues to rise, undergoes cooling and resulting in precipitation The area extent off such rains is small being limited to a diameter of about 10km.
OROGRAPHIC PRECIPITATION The moist air masses get lifted up to higher altitudes due to the presence of mountains barriers and consequently undergo cooling, condensation and precipitation. In the mountain ranges, the windward slopes have heavy precipitation and the lee ward slopes light rainfall
SYMONS RAIN GUAGES It is the non-recording rain guages. It essential consists of a circular collecting area of 12.7 cm in diameter connected to the funnel. The rim of the collector is set in a horizontal plane at a height of 30.5cm above the ground level.
SYMONS RAIN GUAGES The funnel discharges the rainfall, catch into receiving vessel. The funnel and the receiving vessels are housed in a metallic container. Water contained in the receiving vessel is measured by a suitably graduated measuring glass with an accuracy up to 0.1mm. a
SYMONS RAIN GUAGES The rainfall is measured everyday at 8.30 am and is recorded as the rainfall in a day. The receiving bottle normally does not hold more than 10cm of the rain. Proper care must be taken in maintenance and inspections of the rainguages.
SYPHONS RAINGUAGES This is the recording type of rain guages. It is also called as float type rain guages. It uses the siphon mechanism to empty the rain water collected in the float chamber. Rain water entering the guage at the top is led into the float chamber through a funnel and filter
SYPHONS RAINGUAGES The filter is provided to prevent the dust and other particles . The float chart consist of the float with a vertical stem protruding outside to the top of which pen is mounted. This pen rest on a chart secured around a clock driven drum.
SYPHONS RAINGUAGES There is a small compartment by the side of the float chamber which is connected to the float chamber through a small opening at the bottom. This is called as siphon chamber which houses the small vertical pipe. This pipe with the bottom end open and the top end almost touching the top of the chamber.
SYPHONS RAINGUAGES During the rain water is collected in the float chamber raises the water surface in it and along with the water surface the float also rises enabling the pen to a make a trace of cumulative depth of rainfall on the chart
https://www.youtube.com/watch?v=m_ALjsA1Als https://www.youtube.com/watch?v=PbdNB6XlQKc
OPTIMUM NUMBER OF RAIN- GUAGE STATIONS The selected area of a rain guage is very small compared to the areal extent of a storm. To get representative of rain over a catchment area the number of rain- guages should be large as possible. a actual
OPTIMUM NUMBER OF RAIN- GUAGE STATIONS The world meteorological organization recommends the following densities In Flat regions of temperate, Mediterranean and tropical zones: 1. Ideal 1 station for 600-900 km2. 2. Acceptable: 1 station for 900-3000 km2 In mountain region of temperate, Mediterranean and tropical zones: 1. Ideal 1 station for 100-250 km2. 2. Acceptable: 1 station for 250-1000 km2 In arid and polar zones 1 station for 1500-10000 km2 depending upon the feasibility.
OPTIMUM NUMBER OF RAIN- GUAGE STATIONS From practical considerations of Indian conditions, the Indian Standards recommends the following densities as sufficient In Plains 1 station for 520km2. In region of average elevation of 1000m 1 station per 260-390 km2. In predominantly hilly areas with heavy rainfall- 1 station per 130km2
CONSISTENCY OF RAINFALL DATA It is a technique for checking for inconsistency of a record. The causes for the inconsistency of a record is due to: 1. Shifting of a rain-guage to a new location. 2. The neighbour-hood of the station undergoing a marked change. 3. Change in ecosystem due to calamities such as landslides etc. 4. Occurrence of observational error from a certain data
DOUBLE MASS CURVE A group of 5 to 10 base stations in the neighbour-hood of the problem X station is selected. The data of the annual rainfall of the station X and also the average rainfall of the group of the base station covering for a long period is arranged in the reverse chronological order. The accumulated precipitation of the station Px and the accumulated values of the average of the group of base station Pav is calculated starting from the latest record.
DOUBLE MASS CURVE Values of Px are plotted against Pav for the various consecutive time periods. A decided break in the slope of the resulting plot indicates a change in precipitation regime of a station X . The precipitation values at station X beyond the period of change of regime is corrected by using relation Pxc =Px * (Me/Ma) the
COMPUTATION OF MEAN RAINFALL There are three methods to calculate the mean rainfall. They are: 1. Arithmetical Mean Method. 2. Thiessen- Mean Method. 3. Isohyetal Method.
Arithmetical Mean Method. When measured stations in a catchment show little variation, the average precipitation over the catchment area is taken as arithmetical Mean Method.. the rainfall various at
THIESSEN MEAN METHOD In this method the rainfall recorded at each station is given a weightage on the basis of an area closet to the station.
ISOHYETAL METHOD It is the line joining points of equal rainfall magnitude.
PRESENTATION OF PRECIPITATION DATA MOVING AVERAGE CURVE It is a technique for smoothening out the high frequency fluctuations of a time series and to enable the trends, if any noticed. This technique can be applied to other hydrological parameters such as temperature, wind etc.
PRESENTATION OF PRECIPITATION DATA MASS CURVE It is a plot of the accumulated precipitation against the time plotted in chronological order. Records obtained from the float type and weighing bucket type guages are of this form. It is very useful in extracting the information on the duration and magnitude of the storm.
PRESENTATION OF PRECIPITATION DATA HYETOGRAPH It is the plot of the intensity of rainfall against the time interval. It is derived from the mass curve and is usually represented as a bar chart. It represents the total precipitation received in the period. The time intervals depends on the purpose required.