Resource Adequacy Load Forecast Adjustments 2023
The document outlines the process of adjusting load forecasts for resource adequacy in 2023, focusing on factors such as IOU service areas, coincidence factors, peak demand estimates, LSE-specific adjustments, demand-side programs, and pro-rata adjustments. It includes detailed data and forecasts for reference, TAC area peak forecasts, disaggregation of SCE and PG&E TAC forecasts, and methods for calculating service area forecasts. Source links and tables are provided for further reference.
Download Presentation

Please find below an Image/Link to download the presentation.
The content on the website is provided AS IS for your information and personal use only. It may not be sold, licensed, or shared on other websites without obtaining consent from the author.If you encounter any issues during the download, it is possible that the publisher has removed the file from their server.
You are allowed to download the files provided on this website for personal or commercial use, subject to the condition that they are used lawfully. All files are the property of their respective owners.
The content on the website is provided AS IS for your information and personal use only. It may not be sold, licensed, or shared on other websites without obtaining consent from the author.
E N D
Presentation Transcript
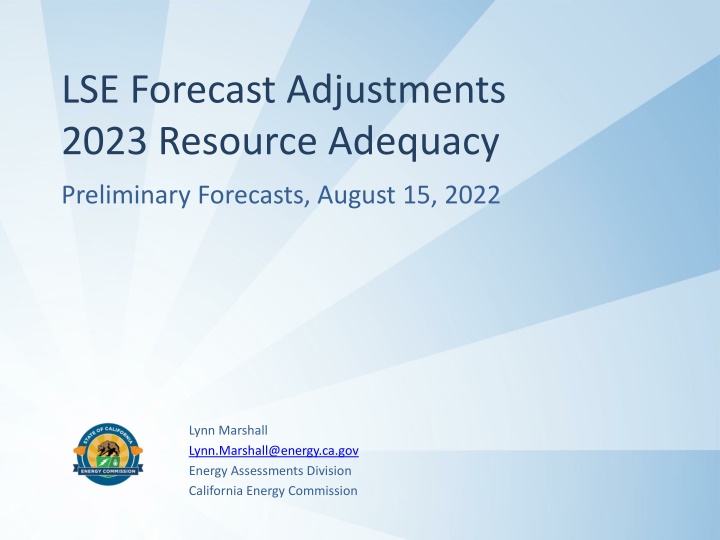
LSE Forecast Adjustments 2023 Resource Adequacy Preliminary Forecasts, August 15, 2022 Lynn Marshall Lynn.Marshall@energy.ca.gov Energy Assessments Division California Energy Commission
Resource Adequacy Load Forecast Adjustment Process 1. Develop reference forecast for IOU service areas and direct access 2. Estimate and apply coincidence factors to LSE forecasts. 3. Develop reference current peak demand estimate for LSEs based on available data. 4. Evaluate need for LSE-specific adjustments. 5. Apply adjustments for incremental effects of demand side programs. 6. Apply pro-rata adjustments to bring the total of the forecasts to within 1% of the CEC service area forecast. 7. Evaluate the reasonableness of pro-rata adjustments and total forecast for each LSE and service area. 8. If step 7 indicates pro rata adjustment is too large (i.e., aggregate DA load significantly exceeds cap), review steps 2-7. 2
2021 IEPR TAC Area Coincident Peak Forecast The reference forecast for CPUC-jurisdictional LSE forecasts begins with the forecasted monthly TAC coincident peaks from the 2021 Integrated Energy Policy Report mid-demand, AAEE Scenario 3, AAFS Scenario 3 demand forecast. The SDG&E reference forecast equals the TAC area forecast. Jan Feb Mar Apr May Jun Jul Aug Sep Oct Nov Dec PGE TAC RA 2022 RA 2023 MW change % change 14,535 14,755 220 1.5% 14,122 14,227 105 0.7% 13,149 13,078 14,308 14,386 16,810 17,073 263 1.6% 19,417 19,979 562 2.9% 20,296 20,748 452 2.2% 19,493 20,412 918 4.7% 19,191 19,574 383 2.0% 15,820 16,076 256 1.6% 13,697 13,717 15,007 15,231 224 1.5% (71) -0.5% 78 19 0.5% 0.1% SCE TAC RA 2022 RA 2023 MW dif % change 13,661 14,089 13,205 13,608 13,374 13,771 14,923 15,463 16,057 16,711 18,693 18,988 20,774 21,176 21,435 21,609 22,177 22,827 17,720 18,583 14,458 14,967 14,245 14,803 427 3.1% 403 3.0% 397 3.0% 540 3.6% 654 4.1% 295 1.6% 402 1.9% 174 0.8% 650 2.9% 863 4.9% 510 3.5% 558 3.9% SDGE TAC RA 2022 RA 2023 MW dif pct dif. 3,043 3,148 106 3,021 3,112 2,877 2,936 2,890 2,960 3,039 3,138 3,014 3,231 217 3,203 3,460 256 3,622 3,916 295 3,957 4,216 260 3,418 3,605 186 3,121 3,238 117 3,149 3,287 139 90 3% 60 2% 70 2% 99 3% 3% 7% 8% 8% 7% 5% 4% 4% 3
IOU Distribution Service Area Reference Forecast Disaggregation of SCE and PGE TAC SCE and PG&E TAC forecasts are disaggregated to CPUC and non-CPUC jurisdictional load using the IEPR service area forecasts and submitted LSE forecasts and hourly loads. Form 1.5b Service Area Annual (noncoincident) Peak Demand 2019 IEPR, RA 2021 18,503 20,881 2020 IEPR, RA 2022 18,625 20,794 2021 IEPR, RA 2023 18,956 21,228 PG&E SCE A top-down service area forecast is calculated by subtracting forecasted coincident peaks of pumping load and other nonconforming load from the TAC monthly coincident peak forecast. The residual monthly peaks are scaled to the IOU annual peak on Form 1.5b. A bottoms-up service area forecast is calculated by subtracting the coincident peaks forecasts of all POUs load from the TAC total. When the aggregated POU forecasts (adjusted to use the IEPR water pumping forecast) are higher than under the top-down estimate, the IOU service area forecast is reduced by using the bottoms-up approach. Sources: CED 2022 Managed Forecast - LSE and BA Tables Mid Demand - Mid AAEE Scenario 3 AAFS Scenario 3, Form 1.5b; https://efiling.energy.ca.gov/GetDocument.aspx?tn=241382 CED 2020 Managed Forecast - LSE and BA Tables Mid Demand - Mid AAEE Case, Form 1.5b https://efiling.energy.ca.gov/GetDocument.aspx?tn=237319&DocumentContentId=70504 4
Comparison of RA 2023 v. RA 2022 PG&E TAC Area Coincident Peak Forecast PGE TAC summer peak loads increase. Time of system peak shifts later in summer months, increasing service area proportionately more than POUs, which have a higher percent of water pumping and other nonresidential load. Jan 12,988 13,229 Feb 12,610 12,704 Mar 11,681 11,572 Apr 12,783 12,861 May 15,130 15,342 Jun 17,596 18,123 Jul 18,380 18,903 Aug 17,585 18,554 Sep 17,293 17,775 Oct 14,134 14,416 Nov 11,956 12,147 Dec 13,414 13,684 PGE TAC RA 2022 RA 2023 MW change RA 2022 RA 2023 MW change 14,535 14,755 220 14,122 14,227 105 13,149 13,078 14,308 14,386 16,810 17,073 263 19,417 19,979 562 20,296 20,748 452 19,493 20,412 918 19,191 19,574 383 15,820 16,076 256 13,697 13,717 15,007 15,231 224 (71) 78 19 PGE Service Area 241 94 (109) 79 211 526 523 969 482 282 191 271 1,200 TAC 1,000 MW Change in RA Forecast 2022-2023 Service Area 800 600 400 200 - Jan Feb Mar Apr May Jun Jul Aug Sep Oct Nov Dec (200) 5
Comparison of RA 2023 v. RA 2022 SCE TAC Area Coincident Peak Forecast Higher recorded data starting point and lower estimated self-generation increase loads in all months Jan 12,152 12,624 Feb 11,846 12,222 Mar 11,892 12,263 Apr 13,171 13,772 May 14,226 14,872 Jun 16,545 16,948 Jul 18,416 18,943 Aug 19,046 19,346 Sep 19,794 20,503 Oct 15,656 16,532 Nov 12,710 13,220 Dec 12,649 13,192 SCE TAC RA 2022 RA 2023 MW dif RA 2022 RA 2023 MW dif 13,661 14,089 427 13,205 13,608 403 13,374 13,771 397 14,923 15,463 540 16,057 16,711 654 18,693 18,988 295 20,774 21,176 402 21,435 21,609 174 22,177 22,827 650 17,720 18,583 863 14,458 14,967 510 14,245 14,803 558 SCE Service Area 472 375 371 601 646 403 527 300 709 876 510 544 1,000 TAC MW Change in RA Forecast 2022-2023 800 Service Area 600 400 200 - Jan Feb Mar Apr May Jun Jul Aug Sep Oct Nov Dec 6
Disaggregation of PGE TAC Forecast to CPUC and POU Forecasts MW (TAC and CPUC) MW (POUs) Disaggregation of PG&E TAC Forecast to CPUC and POU Load Jan Feb Mar Apr May Jun CPUC 13,093 12,573 11,453 12,728 15,182 17,932 18,704 18,359 17,589 14,266 12,022 13,543 POUs 1,472 1,504 1,539 1,542 1,725 1,835 Jul Aug Sep Oct Nov Dec 1,983 2,006 1,985 1,799 1,744 1,635 POU loads are about 10% of the TAC. With proportionately more pumping and other nonresidential load, POU loads have a flatter profile across months. 7
Disaggregation of SCE TAC Forecast to CPUC and POU Forecasts MW (TAC and CPUC) MW (POUs) Jan Feb 11,558 1,260 Mar 11,598 1,604 Apr 13,091 1,817 May 14,180 1,951 Jun 16,919 2,182 Jul Aug 19,140 2,557 Sep 20,544 2,547 Oct 16,142 2,238 Nov 12,544 1,894 Dec 12,519 1,696 CPUC 11,957 POUs 18,767 2,532 1,459 POU loads are about 11%-12% of the SCE TAC loads. 8
Direct Access Reference Estimate Adjustments to ESP forecasts should be consistent with the cap on enrollment, as reflected in recent loads plus expected 2022 and 2023 increases. Staff estimated 2023 coincident peak applying 2021 coincidence factors to estimated monthly energy expected under a full cap. As of May 2022, SCE had not yet reached the cap. Therefore, the preliminary SCE ESP forecasts fall somewhat short of the estimated cap. ESP load forecasts will be revaluated in August using the July Direct Access Service Request data. Estimated Statewide Direct Access Coincident Peak Demand (MW) 4500 4000 3500 3000 2500 2000 1500 1000 500 0 Jan Feb Mar Apr May Jun Jul Aug Sep Oct Nov Dec 2021 Aggregate Coincident Peak Estimated 2023 with DA load at the cap 9
Coincidence Adjustment Methodology Coincidence adjustments should represent expected LSE demand at the time of a 1-in-2 CAISO- wide system peak. Composite loads of LSEs were constructed by compiling 2021 actual loads with migrating load. CAISO hourly loads are ranked. For each high-load hour selected, an LSE and TAC-specific coincidence factor (CF) is calculated: CF= LSE recorded load in TAC at time of CAISO system peak demand / LSE monthly maximum demand in TAC Various statistics on the distribution of CFs are calculated, including median CF of the top 3 to 5 days and percentile distribution of top 10 hours in month (excluding hours before HE 17 PST. Load diversity declines as demand rises, so if the most recent year doesn t include enough relatively high load days, diversity will be overestimated, leading to increased unallocated load. As an alternative, staff may select the CF from the peak hour, a neighboring month, or a previous year. For example, April and May 2021 system loads were quite low, so CFs from April/May 2020, when loads and temperatures were higher, were used for many LSEs. CAISO posts load data used for this analysis annually at: http://www.caiso.com/planning/Pages/ReliabilityRequirements/Default.aspx#Historical Dates and times used by CEC staff are posted on the RA compliance webpage. 10
Load Modifier Adjustments LSE forecasts are credited with a share of net additional achievable energy efficiency and fuel substitution (AAEE/FS) and some load modifying demand response (LMDR) to the extent that it is not accounted for in their forecasts LSE share of incremental AAEE/FS is netted against amounts reported in their forecasts CEC staff reviews other load modifiers (EE, BTM PV, fuel substitution, storage, or transportation electrification) in LSE forecasts for consistency with reference forecast. The SCE LMDR values below also include credit for CPUC-directed procurement of front-of-the-meter storage resource in non-summer months; in the revised forecasts, the FOM storage will not be counted as a load modifier in the month of October. 2023 Incremental AAEE/FS and LMDR Credit AAEE/FS TAC PGE SCE SDGE PGE SCE SDGE Jan Feb Mar Apr May Jun Jul Aug Sep Oct Nov Dec 54 71 25 3 548 66 86 26 3 548 70 89 25 3 549 67 81 22 5 550 14 98 119 24 119 136 29 10 15 11 174 211 41 10 16 13 158 209 39 121 176 37 89 106 25 70 94 26 4 550 10 60 77 23 4 548 LMDR 7 9 9 5 551 10 17 17 17 20 551 13 7 7 9 7 11
LSE-Specific Adjustments LSE forecasts are evaluated using historic loads and temperatures, load factors, review of forecast assumptions, and comparison with CEC forecast assumptions Staff uses weather-normalized loads, month-ahead forecasts, and DASR activity to construct a reference estimate for each LSE by service area: IOU departing load estimates are revised for consistency with CCA forecasts as adjusted by CEC, and CEC-estimated direct access load. Aggregate ESP forecasts are evaluated against the direct access reference estimate to identify need for further adjustments IOU forecasts may also be revised for differences with CEC service area forecast 12
Pro-Rata Adjustment If the sum of the adjusted forecasts differs from the service area reference forecast by more than 1%, the exceedance is allocated based on the share of an LSE s adjusted forecast of total service area adjusted forecasts. 2023 Pro-Rata Adjustment Percent by TAC Jan 1.4% 6.2% 6.9% 4.0% Feb Mar 3.9% 6.4% 4.5% 5.0% Apr May 3.6% 4.7% 8.9% 4.5% Jun Jul Aug 1.8% 0.0% 3.2% 1.1% Sep 2.8% 0.0% -0.5% 4.1% 1.6% Oct Nov 4.4% 5.7% 6.7% 5.3% Dec 3.1% 4.5% 9.2% 4.3% 3.8% 4.6% 6.3% 4.4% 6.2% 4.2% 3.6% 5.0% 2.2% 0.0% 6.6% 1.6% 2.2% 0.0% 1.9% 1.2% 3.6% PGE SCE SDGE Total 1.5% 1.4% 13
Summary of RA 2023 Forecast Adjustments Jan 26,980 Feb 25,993 Mar 25,524 Apr 26,838 May 30,987 Jun 36,416 Jul 40,656 Aug 40,969 Sep 40,927 Oct 33,569 Nov 26,908 Dec 27,109 Submitted LSE Forecasts Coincidence Adjustment (867) (735) (824) (1,077) (1,144) (1,316) (1,869) (1,681) (1,328) (943) (962) (698) Coincidence Adjustment % -3.2% -2.8% -3.2% -4.0% -3.7% -3.6% -4.6% -4.1% -3.2% -2.8% -3.6% -2.6% LSE Specific Adjustments LSE Specific Adjustment % of Coincident Forecast 1,615 1,457 673 2,258 1,892 2,526 1,863 1,851 2,244 1,543 1,091 2,321 6.2% 5.8% 2.7% 8.8% 6.3% 7.2% 4.8% 4.7% 5.7% 4.7% 4.2% 8.8% EE/ LMDR Credit (645) (660) (666) (656) (682) (170) (233) (235) (204) (677) (668) (643) Pro rata adjustment to match CEC forecast within 1% 1,076 1,150 1,243 1,373 1,405 583 467 454 648 471 1,392 1,222 Pro-Rata Adjustment % 4.0% 4.4% 5.0% 5.0% 4.5% 1.6% 1.2% 1.1% 1.6% 1.4% 5.3% 4.3% Total Adjusted Forecasts CEC Coincident Peak Reference Forecast Adjusted Forecasts % of Reference 28,160 27,205 25,949 28,736 32,458 38,039 40,883 41,358 42,288 33,963 27,761 29,310 28,445 27,479 26,211 29,026 32,786 38,267 41,267 41,773 42,450 33,984 28,042 29,607 99.0% 99.0% 99.0% 99.0% 99.0% 99.4% 99.1% 99.0% 99.6% 99.9% 99.0% 99.0% 14
Conclusion Data for these slides will be posted on the CPUC RA compliance page: https://www.cpuc.ca.gov/industries-and-topics/electrical- energy/electric-power-procurement/resource-adequacy- homepage/resource-adequacy-compliance-materials For demand forecast-related questions contact CEC staff at rafiling@energy.ca.gov 15
