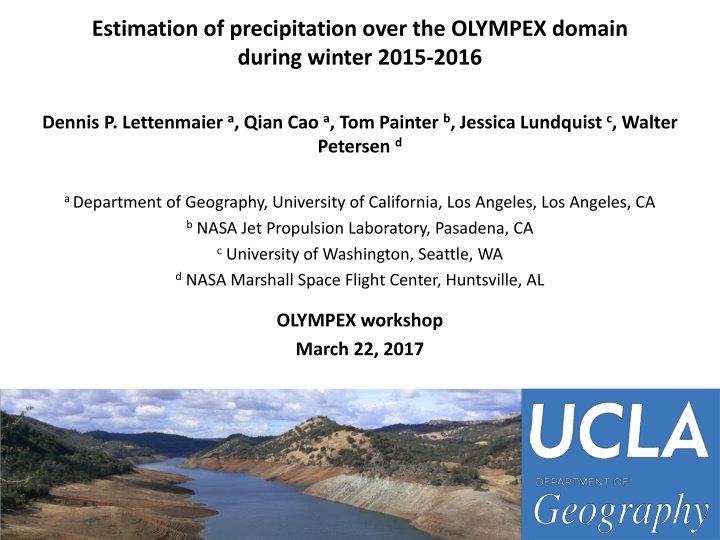
Estimation of Precipitation over the OLYMPEX Domain during Winter 2015-2016
The study aims to evaluate precipitation products over the OLYMPEX domain during the winter of 2015-2016 by utilizing various data sources such as NOAA, NASA, and in-situ observations. The primary goal is to enhance the assessment of Global Precipitation Mission (GPM) products, focusing on regions with limited ground observations and significant orographic influences on precipitation. The research involves analyzing data from different precipitation gauges, radar coverage, and high elevation sites to develop accurate precipitation estimation methods.

Download Presentation

Please find below an Image/Link to download the presentation.
The content on the website is provided AS IS for your information and personal use only. It may not be sold, licensed, or shared on other websites without obtaining consent from the author.If you encounter any issues during the download, it is possible that the publisher has removed the file from their server.
You are allowed to download the files provided on this website for personal or commercial use, subject to the condition that they are used lawfully. All files are the property of their respective owners.
The content on the website is provided AS IS for your information and personal use only. It may not be sold, licensed, or shared on other websites without obtaining consent from the author.
E N D
Presentation Transcript
Estimation of precipitation over the OLYMPEX domain during winter 2015-2016 Dennis P. Lettenmaiera, Qian Cao a, Tom Painter b, Jessica Lundquist c, Walter Petersen d aDepartment of Geography, University of California, Los Angeles, Los Angeles, CA bNASA Jet Propulsion Laboratory, Pasadena, CA cUniversity of Washington, Seattle, WA dNASA Marshall Space Flight Center, Huntsville, AL OLYMPEX workshop March 22, 2017 1
Background and Objective Background A primary goal of Global Precipitation Mission (GPM) is to measure precipitation globally especially in areas lacking ground observations. One goal of the OLYMPEX campaign is to better assess precipitation products based on GPM and other satellites Especially in cold seasons and where orographic factors exert strong controls on precipitation Our objective To develop the best product we can for the evaluation of GPM-based products such as NASA s IMERG over the OLYMPEX domain, which for our purposes was defined as the Olympic Peninsula plus the Chehalis River basin. Our period of analysis is winter 2015-16, which we define as Oct 2015 Apr 2016. precipitation 2
Resources of data Precipitation data NOAA WSR-88D (primarily the site at Langley Hill, on the Washington Coast) NOAA s National Severe Storms Laboratory (NSSL) Mountain Mapper product Precipitation gauges o COOP (Cooperative Observer Network) o CoCoRaHS (Community Collaborative Rain, Hail and Snow Network) o SNOTEL o RAWS (Remote Automatic Weather Stations) o HADS (Hydrometeorological Automated Data System) o ASOS (Automated Surface Observing System) o OLYMPEX Snow data Snow depth maps for the interior of the Olympic Peninsula from two flights of NASA/JPL s Airborne Snow Observatory (ASO) on Feb 8-9 and Mar 29-30 2016 In situ observations 4 SNOTEL sites 3
Langley Hill Radar Terrain blockage of the Langley Hill Radar coverage 4
Precipitation gauges Map of precipitation gauges There are 120 rain gauges that were operational during at least 50% of the period Oct 1 2015 - Apr 30 2016: COOP 7 CoCoRaHS 77 SNOTEL 4 RAWS 1 ASOS 10 OLYMPEX 21 (in Quinault and Chehalis Basins) Elevation distribution of gauges 50 Number of gauges 40 30 20 10 0 5 Elevation (m)
Sites at higher elevations Few stations are located at elevations higher than about 500m Much of the interior Olympic Mountain is above 500 m elevation with substantial winter snow cover, but few measurements Precipitation in this area is winter dominant 6
ASO snow depth maps Feb 8 2016 snow depth map in 3 m resolution overlaid with 1/32 degree mesh Mar 29 2016 snow depth map in 3 m resolution 7
Methodology Estimation of precipitation at lower elevations Merge NOAA National Severe Storms Laboratory (NSSL) Radar product with Mountain Mapper Augment the merged product with 120 additional gauges Estimation of precipitation at higher elevations: We use VIC model driven by observed forcings and adjusted by ASO SWE ahead of two flight dates Temperature from SNOTEL and HOBO sites gridded by daily residuals subtracted from elevation-based seasonal mean Create SWE using ASO snow depth and density field generated by VIC and modified by site observations Adjust precipitation factor to force the simulated SWE to match the ASO SWE 8
Variable Infiltration Capacity (VIC) Macroscale Hydrologic Model 9
Estimation of precipitation at lower elevations Merging NSSL MRMS radar and Mountain Mapper Radar quality index Radar Mountain Mapper mm mm 10
Estimation of precipitation at lower elevations Integration of MRMS radar precipitation with gauge observations Mean daily precipitation (Nov 1 2015~Mar 31 2016) MRMS merged Integrated with additional stations 11
Estimation of precipitation at lower elevations Evaluate merging method by systematically removing individual stations one at a time 12
Estimation of precipitation at higher elevations ASO snow depth aggregated to 1/32 degree 13
Estimation of precipitation at higher elevations ASO SWE Maps 14
Estimation of precipitation at higher elevations Mean daily precipitation (Nov 1 2015 Feb 8 2016) Before Adjustment After Adjustment 15
Estimation of precipitation at higher elevations Mean daily precipitation (Feb 9 2016 Mar 29 2016) Before Adjustment After Adjustment 16
Evaluation of IMERG IMERG (satellite only product) grids within the OLYMPEX domain 17
Storm interarrival time Comparison of exceedance probability of storm interarrival time (in hours) from October 1 2015 to April 30 2016 19
Daily comparison CDF of daily precipitation from October 1 2015 to April 30 2016
Conclusions IMERG hourly data captures the temporal frequency of storms well except for Region II and IV(b) where radar and mountain mapper products show relatively low temporal correlation IMERG tends to underestimate precipitation for all winter months and over all sub-regions The underestimation is higher in mountainous region IV and is obvious especially for orographic enhancement in the mountainous interior of the OLYMPEX domain, up to 87% in region IV(a) on a seasonal basis IMERG shows a better match for the domain average in relatively inland Region II and III where there is less winter precipitation than coastal Region I with more precipitation On a monthly basis, IMERG shows smaller underestimation in October and April when temperature is higher and precipitation is less 22


 Macroscale Hydrologic")