Empower Your Data Management with WISEdash Features
Discover the powerful features of WISEdash for efficient data management. Explore snapshots, user roles, data quality indicators, crosstab filters, and more to enhance your educational analytics. Access student lists and download options easily for streamlined insights.

Download Presentation

Please find below an Image/Link to download the presentation.
The content on the website is provided AS IS for your information and personal use only. It may not be sold, licensed, or shared on other websites without obtaining consent from the author. Download presentation by click this link. If you encounter any issues during the download, it is possible that the publisher has removed the file from their server.
E N D
Presentation Transcript
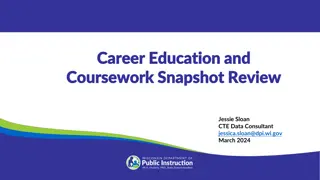
WISEdash Snapshot WISEdash Snapshot Dashboard: Dashboard: Navigation & Overview Navigation & Overview Britt Mueller WISE Relationship Manager, DPI Customer Services Team March 13, 2025
Agenda Agenda WISEsecure User Roles WISEdash Basics Navigation, DQIs, Views, Filters Dashboards TFS, Oct 1, Attendance, Discipline, YE Completion, SpEd Year-End, Perkins, Career Ed & Coursework, Spring Demographics Resources Q&A and Survey
WISEsecure User Roles Basic user roles and advanced user roles for WISEdash are described on the WISE Secure User Roles webpage. .
Application Navigation Application Navigation Dashboards > Snapshots
Data Quality Indicators Data Quality Indicators Data Quality Indicator (DQI) at a glance of your data Points out potential issues 3 types of DQIs Informational count total or percentage Caution data may be questionable or in error Goal: 0 expected total is zero, may still be correct based on student scenario
Current vs Snapshot View Current vs Snapshot View
Dashboard & Crosstab Filters Dashboard & Crosstab Filters (1 of 2) (1 of 2)
Dashboard Filters Dashboard Filters (2 of 2) (2 of 2)
View Student List View Student List If you want to see the students listed within a filter topic: Click the underlined topic total for a list of students within that filter selection.
Download Student List Download Student List If you want to download the student list: Click the Send button in the upper right corner of the graphic, then Download your preferred file type.
Important to Note Important to Note Accountable vs Attending Accountable (default) the student may or may not attend your district but you are responsible for the accountability of the student Attending the student attends your district but you may or may not be accountable for them Acctbl School vs Acctbl Sch Acctbl School longer title of school name Acctbl Sch shorter title of school name
TFS Count Date TFS Count Date Review DQIs and student count inclusion total Use filters to disaggregate the total into more manageable size (grade, school, race) to review against SIS reports Use filters to review totals for important demographics Economic Disadvantaged English Learners Homeless If the Count Inclusion Total is incorrect, view the student list to see the discrepancy. Once determined, Review the student(s) in WISEdata to see if a validation message is impacting inclusion value Review the student(s) in your SIS to see if the inclusion value is set and sending correctly
Oct 1 Child Count Oct 1 Child Count Review DQIs and student count inclusion total Use filters to disaggregate the total into more manageable size (grade, school, race) to review against SIS reports Use filters to review totals for important demographics Disability Education Environment PPP Status If the Count Inclusion Total is incorrect, view the student list to see the discrepancy. Once determined, Review the student(s) in WISEdata to see if a validation message is impacting inclusion value Ensure sSEPA record dates encompass Oct 1 date Review the student(s) in your SIS to see if the inclusion value is set and sending correctly
Oct 1 Child Count: Screenshots Oct 1 Child Count: Screenshots
Attendance Attendance Review DQIs and Attendance data Use Filter Data > Group By option to review attendance rate by different demographics to review against SIS reports Grade Level Disability Economic Status Race/Ethnicity Homeless If the overall Attendance Rate is incorrect, view the Group By and student lists to see the discrepancy. Once determined, Review the student(s) in WISEdata to see if a validation message is impacting attendance Review the student(s) in your SIS to see if their attendance is reported and sending correctly
Attendance: Screenshots Attendance: Screenshots
Discipline Discipline Review DQIs Review Dashboards Disciplinary Incidents Disciplinary Actions Use filters to review disciplinary totals by different demographics to review against SIS reports Serious Injury Behavior If the disciplinary data is incorrect, view the student list to see the discrepancy. Once determined, Review the student(s) in WISEdata to see if a validation message is impacting discipline Review the student(s) in your SIS to see if their discipline is reported and sending correctly
Discipline: Screenshots Discipline: Screenshots
YE (Year End) Completion YE (Year End) Completion Review DQIs Review Dashboards Exits and Retention HS Completion for Grad Cohort (4 Year or Less) Dropouts Use filters to review year end totals by different demographics (grade, school, race) to review against SIS reports Use filters to review totals for additional year end data Completed School Term HS Completion Year Reason Exit SPED
YE (Year End) Completion: 4 Year Grads YE (Year End) Completion: 4 Year Grads DQI 4 Year Graduation Rate HS Completion for Grad Cohort (4 Year or Less) Dashboard The Snapshot dashboard data only include the 4-year or less rate for that year s graduating cohort Students that graduate after their cohort can be reviewed in the Menu >Topics > Graduation > HS Completion Rates dashboards Grad Rate percentage includes all students when you click it so you will need to filter column Completion Status for non-completer student list to review
YE (Year End) Completion: Dropout YE (Year End) Completion: Dropout DQI Dropout Rate Dropout Dashboard Midterm student left midway through the prior year and is not reported as receiving services by current year TFS (student has less than one year to return) Full term student completed the school year two years prior but is not reported as receiving services by current year TFS (student has over one year to return) Dropout Rate percentage includes all students when you click it so you will need to filter column Dropout Indicator for student list to review
SpEd Year SpEd Year- -End End Review DQI and Dashboards SPED Indicator 11 SwD Ages 14-21 Exiting Special Education Use filters to disaggregate the total into more manageable size to review against SIS reports Use filters to review totals for important demographics Met 60 Day Determination IDEA Indicator If the totals are incorrect, view the student list to see the discrepancy. Once determined, Review the student(s) in WISEdata to see if a validation message is impacting special education reporting Review the student(s) in your SIS to see if the special education values are set and sending correctly
SpEd Year SpEd Year- -End: Screenshots End: Screenshots
Perkins Perkins Use this dashboard to review CTE Student totals Review DQI Review dashboard for CTE student count totals CTE Concentrators CTE Participants CTE Graduates Use filters to review totals by different demographics (grade, school, race) to review against SIS reports Use filters to review totals for additional CTE data IAC Code Career Pathway Program Area
Perkins: Screenshots Perkins: Screenshots
Career Education & Coursework Career Education & Coursework (1 of 4) (1 of 4) Student Participation Count: yes/no if student participates, counted ONLY once Outcome Count student can be counted more than once depending on the different outcomes based on their participation Review DQIs and Dashboards Technical Skills Attainment Advanced Credit Opportunities Arts Use filters to review totals by different demographics (grade, school, race) to review against SIS reports Use filters to review totals for additional career education & coursework data Program/Credit Type Program Status students are not captured in the report card if they don t have a status
Career Education & Coursework Career Education & Coursework (2 of 4) (2 of 4) Technical Skills Attainment Certified Career Ed Programs Industry Recognized Credentials (IRCs) Youth Apprenticeship State Co-ops Non-certified Career Ed Programs Internship/Local co-ops Simulated Worksite School-based Enterprise Supervised Agricultural Experience Entrepreneurial Student Business Filter by Program Type Program Name Completion Status
Career Education & Coursework Career Education & Coursework (3 of 4) (3 of 4) Advanced Credit Opportunities Dual Enrollment Program Participation in Dual Enrollment and the HS Passing Status is what should be reported, not the post-secondary passing status Advanced Placement (AP) Courses International Baccalaureate (IB) Courses Filter by Advanced Credit Type Passing Status
Career Education & Coursework Career Education & Coursework (4 of 4) (4 of 4) Arts, Arts Type: Based on the roster SCED code you report on the course Music Visual Arts Dance Theater Media Arts Other Filter by Arts Type Passing Status
Spring Demographics Spring Demographics Use filters to disaggregate the data into more manageable size (grade, school, race) to review against SIS reports. Use filters to review totals for important demographics: Economic Disadvantaged English Learners Students with Disabilities Homeless If the totals are incorrect, view the student list to see the discrepancy. Once determined, Review the student(s) in WISEdata to see if a validation message is impacting data. Review the student(s) in your SIS to see if the demographics are reported and sending correctly.
Spring Demographics: Screenshots Spring Demographics: Screenshots
Resources Resources WISEdash for Districts About the Data: Snapshot Dashboards: Includes general information on how the dashboards work, definitions of filters, and details about the data of individual dashboards Snapshot Preparation Guidance: Includes what data is collected in which snapshot, who needs to submit it, why, snapshot preparation presentations and webinars, FAQs, and more WISEdash for Districts: Information, Help, and FAQ WISEdash for Districts Training and User Guide: Contains "how-to" guides, tutorial videos, and other resources
Q & A Q & A Scan the QR Code to go to the WISEdata 2025 Conference webpage. You can leave feedback, view the agenda, read about the sessions, and more! Thank you!


 Completion")
 Completion: 4 Year Grads")
 Completion: Dropout")