Drought Outlook Support Briefing April 2022 Insights
The Drought Outlook Support Briefing for April 2022 highlights the complexities of short-term and long-term drought scenarios, emphasizing the importance of monitoring current conditions to forecast future trends. The briefing discusses the ongoing La Niña impact, potential effects on the southwest monsoon, and the contrasting drought situations between the East and West in the U.S. Key points include the role of ENSO, regional drought climatology, and precipitation anomalies influencing drought patterns. Stay informed on the evolving drought forecasts and implications for various regions.

Download Presentation

Please find below an Image/Link to download the presentation.
The content on the website is provided AS IS for your information and personal use only. It may not be sold, licensed, or shared on other websites without obtaining consent from the author. If you encounter any issues during the download, it is possible that the publisher has removed the file from their server.
You are allowed to download the files provided on this website for personal or commercial use, subject to the condition that they are used lawfully. All files are the property of their respective owners.
The content on the website is provided AS IS for your information and personal use only. It may not be sold, licensed, or shared on other websites without obtaining consent from the author.
E N D
Presentation Transcript
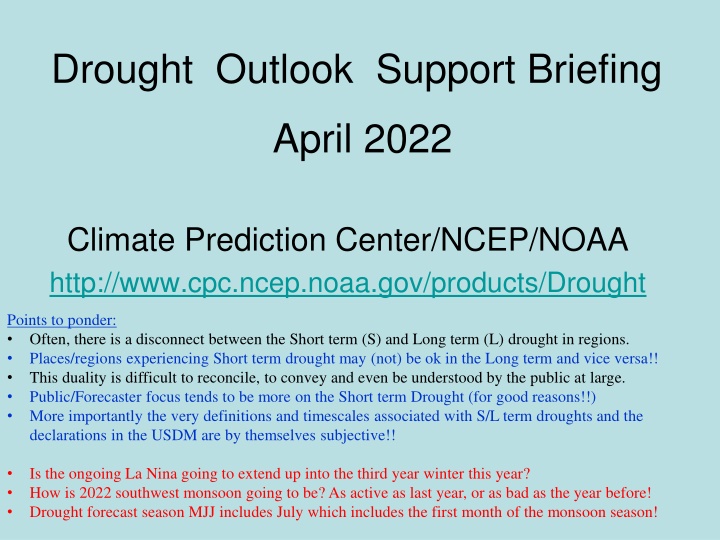
Drought Outlook Support Briefing April 2022 Climate Prediction Center/NCEP/NOAA http://www.cpc.ncep.noaa.gov/products/Drought Points to ponder: Often, there is a disconnect between the Short term (S) and Long term (L) drought in regions. Places/regions experiencing Short term drought may (not) be ok in the Long term and vice versa!! This duality is difficult to reconcile, to convey and even be understood by the public at large. Public/Forecaster focus tends to be more on the Short term Drought (for good reasons!!) More importantly the very definitions and timescales associated with S/L term droughts and the declarations in the USDM are by themselves subjective!! Is the ongoing La Nina going to extend up into the third year winter this year? How is 2022 southwest monsoon going to be? As active as last year, or as bad as the year before! Drought forecast season MJJ includes July which includes the first month of the monsoon season!
Drought Monitor March Monitoring is important because, unlike US T/P fcsts, for drought forecasts, we have to know where we are, before we can tell where we are going!! Drought forecasts are tendency forecasts. February As the winter rainfall season is coming to a close along the Pacific West, the severe drought has also expanded further from last month. The excess winter snowfall in/near the Great Lakes region has slightly improved the drought conditions in the region. Besides this, elsewhere in the west, in the west central mountain and vicinity, and the southwest the overall drought situation has remained the same from last month. January April (Recent/Latest) The short and temporary drought conditions along the mid-Atlantic coastal regions, and east coast droughts (unlike the southern/western US droughts) generally do not last long. Hence these droughts go back and forth in intensity and extent, and need not be of much concern, even though their short term effects do matter. December ? 2
(Previous) Seasonal/Monthly Drought outlooks New Seasonal+ Drought Outlook to be released in 2 days! New Monthly Drought Outlook to be released end of this month) Updated Seasonal Outlook (1 Apr. 30 Jun 30, 2022) issued 3/31/22 Monthly outlook (for April 2022) issued 3/31/22 It is the classic great West versus East drought paradigm !! US East droughts are different than West droughts!! This is mainly related to the rainfall climatology! Of course ENSO impact matters! 3
Time series since 2000 spilt into 2 (above & below) panels. Every drought is different.! The recent drought has somewhat stagnated ? Every situation is different!! D3/D4 areas have decreased. But, D0/D1/D2 areas increased. Current drought! Last month we said: As the La Nina is slowly weakening and is on its way out, have we seen the worst of the current drought status over the US for now? Now: Well, Looks like the La Nina is not going away yet! And Drought is expanding!! 4
Precipitation ANOM during last 7, 14, 30, & 60 days. This and next few slides show Precip deficit (excess). Droughts, for the MOST part, begin and end with precip!! Lately, Temps are becoming (secondarily) important as well. 60 Days 14 Days 30 Day 7 Days These maps in this and following slides, including a) Total, b) Anom and c) Percent of Normal precip. in these and other longer time ranges are now (routinely) daily updated at: ? 5 From: Recent Accumulated Precipitation https://www.cpc.ncep.noaa.gov/products/Drought/briefing_prcp.shtml
Precipitation Percent (of normal) during last 7, 14, 30, & 60 days - Only Deficit Areas <=90% shown ! 60 Days 14 Days This plot shows only the rainfall deficient regions <= 90% of normal. -- This shows more clearly possible/likely drought developing region in the future unless there is above normal rainfall in these regions in the future, to offset these shortfalls. 30 days 7 Days 6 From: Recent Accumulated Precipitation https://www.cpc.ncep.noaa.gov/products/Drought/briefing_prcp.shtml
Total precipitation ANOM during last 3, 4, 5, and 6 months. 6 M 4 M While the Precipitation anomalies deficit may seem large in some regions (compared to others), it is the % of normal precip (next slide) that matters more!! 5 M 3 M But ~ this happened!! Typical JFM Precip composite during La Nina to be expected! Fcst 7 From: Recent Accumulated Precipitation https://www.cpc.ncep.noaa.gov/products/Drought/briefing_prcp.shtml
Total precipitation Percent(of normal) during last 3, 4, 5, and 6 months Only Deficit Areas <=90% shown!! 4 M 6 M In these interim time scale 3-6 months, we need to pay attention to regions, which are dark-brown, red & dark red (<50%). Not so bad along coast! in % While accrued precipitation deficits are real & objective, droughts are subjective declarations!! 3M 5 M East vs West! Broad vs Narrow rainfall season. In general, West suffers more from frequent and lasting droughts. Short term(S) Drought is generally declared when rainfall deficits exist in the 3-6 months time range. { Long term deficits beyond 1 or 2 years is Long term L drought! } 8
Total precipitation Percent during last 9 months, 1 yr, 1.5yrs, & 2 yrs. .Only Deficit Areas shown!! <=90% 1 Y 2 Y Tinderbox areas, where some form of longer term rainfall deficiencies already, exist !! -Almost all are in the west!, all part of the long term drought 1.5 Y 9 M -This & Next slide!! The character and even location/spatial extent of the short/S and long/L term droughts are different!!! 9 From: Recent Accumulated Precipitation https://www.cpc.ncep.noaa.gov/products/Drought/briefing_prcp.shtml
Total precipitation Percent (of normal) during last 2, 3, 4, & 5 yrs. .Only Deficit Areas <=90% shown !! 3 Y In these long time ranges (2-5 yrs), there is a general dearth/lack of precipitation in the southwest US. 5 Y Weather Blog News Today: A recent study from the University of California, Los Angeles now claims the current drought that started in 2000 for theAmerican Southwest is now the driest 22 years since 800 A.D. Researchers said climate change is to blame. Their proof? Tree rings. 4 Y 2 Y Ongoing long term drought in the SouthWest!! 3rd year La Nina(?) will make it worse!!. 10 From: Recent Accumulated Precipitation https://www.cpc.ncep.noaa.gov/products/Drought/briefing_prcp.shtml
AMJ: End of rainy season in w. coast. Begin of rainy season in northern & central high plains. East vs West! More darker colors in west/central => narrow rainy season (months) Rainy (3- month)Season across the US Overall, more white space in the east => distributed rainfall season (except ~FL). 11
For the forecast season MJJ, we are entering the rainy season for the northern Great Plains and states to the south oninto southwest. ********* EAST vs CTR/WEST Drought Behavior is loosely tied to rainfall climo!! And the limited rainy season in the west ********* 12 Adapted from Rich Tinker.
La Nina Precip/Temperature COMPOSITES & Trend map MJJ P T 1 + 1 = Look at frequency along southeast! Over 70% 2 13
----- NOW The Standardized Precipitation Index SPI (based on Observed P) Very interesting graphic & details for the drought across the US based on the more generalized precip deficit/excess, the Standardized Precipitation Index (SPI). Short The short term drought has somewhat shifted/extended from southwest to northwest and the northern Plains. But the long term drought in the southwest remains. The dark brown and red colors, indicating standardized precipitation deficits, in the various time periods, approximately correspond to the appropriate short/long term drought monitor regions and their intensities Long How does one negotiate and reconcile declaring short term vs long term drought when precip. deficiencies patterns differ on many different time scales locally!! At exactly where does drought begin? What is the cutoff delineating time between short VS long term drought!! Not so clear!! 15
Slide from last month.. -Slide not shown now. Recent US Temperatures So far in March, temps. looking similar to February. There is a lot more going on than just La Nina!! So far this month !! 16
Now.. Recent US Temperatures So far in April, temps. across much of the northern 2/3rd of country is cold, warm along south and northeast. Lot different than last month/March! There is a lot more going on than just La Nina!! So far this month !! 17
April March Last month This month Most CA water reservoirs are drastically low! Third year of La Nina (if it comes!) this coming winter, will make drought conditions even worse for CA!!! 18
19 Streamflow (USGS) Most US east droughts are relatively short lived (as compared to US west). However, if you recall, the drought over the New England states last year was a real surprise!! Map shows only below normal 7-day average streamflow compared to historical streamflow for the day of year. One month ago (left) & Now (below) Streamflow is only a partial indicator, as it is highly managed. Look along the Pacific coastal states. If sometimes, the various indicators are confusing, go back to % of rainfall deficit maps to reinforce!! 19
EL NIO/SOUTHERN OSCILLATION (ENSO) DIAGNOSTIC DISCUSSION issued by CLIMATE PREDICTION CENTER/NCEP/NWS and the International Research Institute for Climate and Society 14 April 2022 ENSO Alert System Status: La Nina Advisory Synopsis: La Ni a is favored to continue through the Northern Hemisphere summer (59% chance during June-August 2022), with a 50-55% chance through the fall. CPC s Oceanic Ni o Index (ONI) [3 month running mean of ERSST.v5 SST anomalies in the Ni o 3.4 region (5oN-5oS, 120o-170oW)], based on centered 30-year base periods updated every 5 years. 20
Latest values of SST indices in the various Nino Regions. 21
Sub-Surface Temperature Departures in the Equatorial Pacific The subsurface cold anomalies in east Pacific are slowly strengthening and expanding in space and volume. Warm waters in the WP/CP that strengthened earlier have recently stalled. Most recent pentad analysis Last month we said: It is not clear which way, the subsurface waters will go in the next few/many months!! That s why the 50/50 chance But NOW, it looks like La Nina odd are higher!! 22
ENSO Forecasts Early- March CPC/IRI forecast Early- April CPC/IRI forecast Dynamical, Statistical, CPC-Consolidated fcsts are coming together!! But still at ~ -0.5C ! As compared to last month, the odds of La Nina (for next several months) has slightly increased !! But spread/uncertainty (also towards neutral!) is still there. 23
Previous (Last Months) CPC s official Temperature OUTLOOK for Monthly (April)/Seasonal (AMJ) Released Jan 20th Observed so far this month!! 24
Previous(Last month) CPC s official Precipitation OUTLOOK for Monthly (April)/Seasonal (AMJ) Released Jan 20th Very similar looking! Based on La Nina !!!! Observed so far this month!! Monthly P/T forecasts verified at mid-month are generally good! Becoz of good skill upto 2 wks. But so far , esp. along the west ! 25
NCEP/WPC Next 7 days QPF (Quantitative Precipitation Forecast) GFS Model Guidance for the next 16 days. A good amount of rain is forecast/expected along the Pacific Northwest in WA/OR/northern CA, as well as over ND, MN, and over MO and adjacent regions. Mid Atlantic states will get relief from the dry conditions. 26
From European Center (EC) Precip forecast (made yesterday, 18 Apr) for next 30 days. 27
From European Center (EC) Precip forecast (made yesterday, 18 Apr) for next 30 days. 20 40 28
From European Center (EC) Precip forecast (made yesterday, 18 Apr) for next 30 days. 29
From European Center (EC) Precip forecast (made yesterday, 18 Apr) for next 30 days. 30
Week-4 Soil Moisture Percentile (SMP) Fcst based on VIC model forced with ECMWF- extended precipitation forecast! Now: Yesterday s IC ?? (From Drs. Li Xu and Yun Fan) More detail at From: https://www.cpc.ncep.noaa.gov/products/people/lxu/flashd/flash_prediction.html
NMME T & P Ens.Mean forecasts for May MJJ 32
Agreement/Disagreement among the various NMME models MJJ seasonal Precip. Forecast. ?? 33
(From NMME) compared with this month(foreground, red border) Why is there so fewer hatched areas in SPI6 fcst from NMME models based fcst this month as compared to last month (left 2 columns) ? Fcsts more confident now? Forecast uncertain in Hatched areas. These maps are based on NMME models precip forecast uncertainty/certainty (among ensemble members) over the next 3 months SPI6 Fcst made from last month 34 SPI6 & SPI12 Fcst made from this month
Summary Current Drought conditions: As the winter rainfall season is coming to a close along the Pacific West, the severe drought has also expanded further from last month. The excess winter snowfall in/near the Great Lakes region has slightly improved the drought conditions in the region. Besides this, elsewhere in the west, in the west central mountain and vicinity, and the southwest the overall drought situation has remained the same from last month. The short and temporary drought conditions along the mid-Atlantic coastal regions, and east coast droughts (unlike the southern/western US droughts) generally do not last long. Hence these droughts go back and forth in intensity and extent, and need not be of much concern, even though their short term effects do matter. Most CA water reservoirs are drastically low! This is particularly consequential as the rainy season is just about to end. Current ENSO status and forecast: La Ni a is favored to continue through the Northern Hemisphere summer (59% chance during June-August 2022), with a 50-55% chance through the fall. Prediction: It appears that the La Nina may not be gone after all, and may continue to stay through the next forecast season MJJ and possibly beyond. With this, we can continue to expect the canonical impacts for the season. The observed T/P anomalies even during the past peak La Nina conditions in the winter months resembled only weakly similar/like the forecasts or the past La Nina composites. In spite of these, especially as the winter rainy season is coming to an end along the west coast states, the long term existing drought in the western and southwestern states will continue to stay and persist during MJJ. MJJ is the rainy season in the northern Great Plains and the upper central Plains, and we may expect improvement or even removal of drought in some of these regions. But the NMME models do not support this and predicts below normal rainfall, and hence the drought in these regions may persist and may even get worse. In the southeastern Gulf/Atlantic coastal states, only weak, temporary and short term dryness drought conditions exists now. For the forecast season MJJ, even though the climatology is favorable, the removal of those conditions depends on the nature and strength of the La Nina conditions. The short term rainfall and the NMME models forecast for the season seem to indicate the existing drought conditions in MS eastward onto and along the Atlantic coastal states will likely go away by the end of the forecast season. However, the near 50% chance of weak La Nina conditions in the upcoming months makes the forecast that much difficult especially in these transition months. *************


 Seasonal/Monthly Drought outlooks")
 panels.")

 during last 7, 14, 30, &")

 during last 3, 4, 5,")

 during last 2, 3, 4,")


")


")
")

 Precip forecast (made yesterday,")
 Precip forecast (made yesterday,")
 Precip forecast (made yesterday,")
 Precip forecast (made yesterday,")
 Fcst based on VIC")


 compared with this")