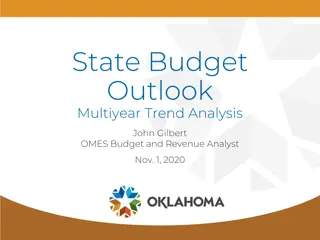
State Budget Outlook Multiyear Trend Analysis by Chris Cremin - Nov. 1, 2023
Analysis of Oklahoma's state budget outlook, including revenue and expenditure projections for the current fiscal year and the next two years. The report covers recurring revenue trends, major fund details, authorized expenditures, and budget outlook trends.
Download Presentation

Please find below an Image/Link to download the presentation.
The content on the website is provided AS IS for your information and personal use only. It may not be sold, licensed, or shared on other websites without obtaining consent from the author.If you encounter any issues during the download, it is possible that the publisher has removed the file from their server.
You are allowed to download the files provided on this website for personal or commercial use, subject to the condition that they are used lawfully. All files are the property of their respective owners.
The content on the website is provided AS IS for your information and personal use only. It may not be sold, licensed, or shared on other websites without obtaining consent from the author.
E N D
Presentation Transcript
State Budget Outlook Multiyear Trend Analysis Chris Cremin OMES Budget and Revenue Analyst Nov. 1, 2023
Statutory Reference 62 OK Stat 49 (2022) On or before November 1 of each year, the Office of Management and Enterprise Services shall develop and publish a multi-year trend analysis of the state's budget outlook which includes the current fiscal year, the ensuing fiscal year and the following two (2) fiscal years. The trend analysis shall include projections of revenues and expenditures reflecting the best available information concerning economic activity, population change, policy developments and other factors affecting the state budget. The analysis shall be provided to the President Pro Tempore of the Senate, members of the Senate Appropriations and Finance Committees, the Speaker of the House of Representatives and members of the House Appropriations and Budget Committee.
Recurring Revenue Trends Major Fund Detail Recurring Revenues (in millions) $14,000 June 2023 BOE Est. Actuals Projection $11,328 $12,000 $11,038 $10,808 $10,587 $9,618 $10,000 $8,903 $8,811 $8,000 $6,000 $4,000 $2,000 $0 FY-21 FY-22 FY-23 FY-24 FY-25 FY-26 FY-27 General Revenue Fund (3.33%) 1017 FUND (2.09%) ROADS Fund TRS Dedicated Revenues (0.42%) Other Funds (-2.27%) Notes: Projections are policy agnostic and based on historical trends. GRF projection uses a 15-yr. avg. growth rate. ROADS Fund is capped at $590 million. All other projections use a 10-yr. normalized growth rate. Totals above consist of the Legislature s Expenditure Authority excluding one-time cash and federal monies. GRF is a Certified Fund (Expenditure Authority is 95% of estimated collections). TRS, 1017 and ROADS Fund are Authorized Funds (Expenditure Authority is 100% of estimate).
Appropriation Trends by Expenditure Category Total Authorized Expenditures (in millions) $14,000 Projected Appropriations Trends for FY-25 through FY-27 exclude approximately $2.1 billion in one-time expenditures and approximately $213 million in supplemental appropriations made in FY-24 from the recurring expenditure base. $12,961 $12,000 $10,811 $10,807 $10,751 $10,692 $9,489 $10,000 $8,463 $8,000 $6,000 $4,000 $2,000 $0 FY-21 Education FY-22 FY-23 FY-24 FY-25 FY-26 FY-27 Health and Mental Health Human Services Public Safety Transportation Other Note: Expenditure projections are policy agnostic and based on historical trends. Expenditures from TRS and the ROADS Fund were not previously classified as appropriations but have been included in this graph for comparison.
Budget Outlook Trends Recurring Revenues vs. Appropriations Trend-based projections (in millions) 14000 $12,961 13000 12000 $11,328 $11,038 $10,807 $10,808 11000 $10,811 $10,751 $10,692 $10,587 10000 $9,489 $8,903 $9,618 9000 $8,811 8000 $8,463 7000 6000 June 2023 BOE Est. 5000 Actuals Projection 4000 FY-21 FY-22 FY-23 FY-24 FY-25 FY-26 FY-27 Authorized Expenditures Recurring Revenues Notes: Projections are policy agnostic and based on historical trends. Revenue projections have been adjusted for Parental Choice Tax Credit. Authorized Expenditures from FY-21 through FY-24 include one-time expenses, supplemental appropriations and expenditures funded through cash. Recurring Revenues for all years exclude one-time cash.
General Revenue Collections Recurring Revenue Comparison GRF as a Percentage of Recurring Revenue (in millions) 79.8% $12,000 79.3% 78.8% 78.3% 93.7% $10,000 96.4% 78.7% $8,000 $6,000 $4,000 $2,000 $0 FY-21 FY-22 FY-23 FY-24 FY-25 FY-26 FY-27 GRF Collections Recurring Revenues Note: Projections are policy agnostic and based on historical trends. GRF Collections for FY-25 through FY-27 assume a 15-yr. avg. growth rate of 3.33% Recurring Revenues consist of the Legislature s total Expenditure Authority excluding one-time cash.
General Revenue Expenditures Appropriations Comparison GRF as a Percentage of Total Authorized Expenditures (in millions) $14,000 58.0% $12,000 63.6% 72.8% 73.8% 71.7% 63.9% $10,000 62.1% $8,000 $6,000 $4,000 $2,000 $0 FY-21 FY-22 FY-23 FY-24 FY-25 FY-26 FY-27 Appropriations from GRF Total Authorized Expenditures Note: Projections are policy agnostic and based on historical trends. GRF Appropriations for FY-25 through FY-27 assume a 15-yr. avg. growth rate of 1.99%. Total Authorized Expenditures from FY-21 through FY-24 include one-time expenses and supplemental appropriations which have been removed from projections for FY-25 through FY-27. Expenditures from TRS and the ROADS Fund were not previously classified as appropriations but have been included in this graph for comparison.
General Revenue Fund Trend Detail
General Revenue Fund Trends Revenue vs. Expenditures from GRF Trend-based projections (in millions) 10000 $9,044 $9,014 $8,750 9000 $8,515 $8,494 $8,289 8000 $7,979 $7,824 $7,671 $7,008 $7,522 7000 $6,872 6000 $6,065 5000 $5,252 June 2023 BOE Est. Actuals Projection 4000 FY-21 FY-22 FY-23 FY-24 FY-25 FY-26 FY-27 Expenditure Projections using 15-yr avg growth rate (1.99%) Revenue Projections using 15-yr avg growth rate (3.33%) Notes: Revenue projections have been adjusted for Parental Choice Tax Credit.
General Revenue Fund Detail Major Sources Trend-based projections (in millions) $4,000 June 2023 BOE Est. Actuals Projection $3,500 $3,000 $2,500 Personal Income Tax (2.44%) Corporate Income Tax (1.96%) $2,000 GPT-Gas (-5.43%) GPT-Oil (-10.07%) $1,500 Sales Tax (-0.43%) $1,000 $500 $0 FY-21 FY-22 FY-23 FY-24 FY-25 FY-26 FY-27 Notes: GRF component projections use a 15-yr. normalized growth rate. Personal Income Tax projections have been adjusted for Parental Choice Tax Credit.
General Revenue Fund Trends Major Source Detail Trend-based projection (in millions) $10,000 June 2023 BOE Est. Projection Actuals $9,000 $7,692 $8,000 $7,246 $7,189 $7,148 $7,139 $7,115 $7,000 $5,884 $6,000 Sales Tax (-0.43%) GPT-Oil (-10.07%) $5,000 GPT-Gas (-5.43%) Corporate Income Tax (1.96%) $4,000 Personal Income Tax (2.44%) $3,000 $2,000 $1,000 $0 FY-21 FY-22 FY-23 FY-24 FY-25 FY-26 FY-27 Notes: GRF component projections use a 15-yr. normalized growth rate. Personal Income Tax projections have been adjusted for Parental Choice Tax Credit.
Definitions Authorized Expenditures: Appropriations and spending authorizations made by the Legislature. Authorized Funds: Funds not certified by the Board of Equalization. For these non-certified funds, the Legislature authorizes the expenditure amount from the fund based on total (100%) estimated collections. Cash: Unspent revenues from previous fiscal years available for expenditure in the current fiscal year. Certified Funds: Funds certified by the Board of Equalization. Certified revenue is equal to 95% of total estimated collections to each certified fund. ERRF / 1017 Fund: The Education Reform Revolving Fund is an Authorized Fund created by HB 1017 in 1990. Serves as a dedicated source of state revenues appropriated to the Department of Education. Expenditure Authority: All funds, including recurring revenue and cash, the Legislature has authority to spend for the fiscal year. Fiscal Year (FY): Financial and accounting year beginning July 1 and ending June 30. General Revenue Fund: The largest Certified Fund and the primary funding source for most authorized expenditures and government operations. Normalized Growth Rate: An average of year-over-year change, excluding years which are outliers, as defined by annual growth rates exceeding the standard deviation for the period. ROADS Fund: The Rebuilding Oklahoma Access and Driver Safety Fund was created in 2005 to ensure dedicated revenue for the maintenance and repair of state highways and bridges. In FY 2022, the fund was capped at $590 million per year. Recurring Revenue: The total base of state revenues the Legislature has access to each fiscal year, consisting of Authorized Funds and Certified Funds, excluding one-time cash and federal monies. TRS Dedicated Revenues: Dedicated source of state revenues appropriated to the Teachers Retirement System. Became an Authorized Fund as of FY 2023.
