Drought Impact and Climate Change in Jordan
Analysis of the impact of water scarcity and drought in Jordan, focusing on the most affected areas, implications of climate change, and the Middle East's vulnerability to water insecurity. The research explores the intersection of climate change, water resources, agriculture, and food security, highlighting the regional drought of 2008 and predicting future climate change effects. Global and regional climate change challenges are outlined, emphasizing the urgency of addressing water scarcity issues in the Middle East.

Download Presentation

Please find below an Image/Link to download the presentation.
The content on the website is provided AS IS for your information and personal use only. It may not be sold, licensed, or shared on other websites without obtaining consent from the author.If you encounter any issues during the download, it is possible that the publisher has removed the file from their server.
You are allowed to download the files provided on this website for personal or commercial use, subject to the condition that they are used lawfully. All files are the property of their respective owners.
The content on the website is provided AS IS for your information and personal use only. It may not be sold, licensed, or shared on other websites without obtaining consent from the author.
E N D
Presentation Transcript
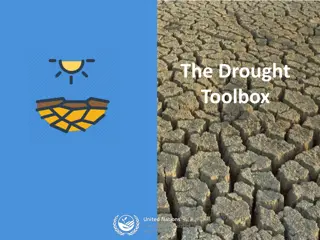
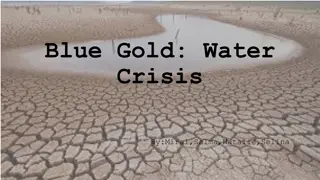
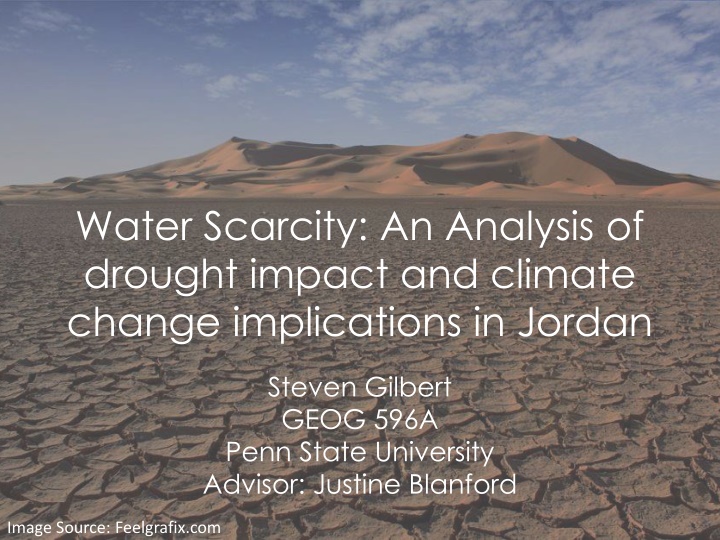
Water Scarcity: An Analysis of drought impact and climate change implications in Jordan Steven Gilbert GEOG 596A Penn State University Advisor: Justine Blanford Image Source: Feelgrafix.com
RESEARCH QUESTION Who is most affected by drought in Jordan? What areas are most impacted by drought? How will climate change impact areas affected by drought?
OUTLINE Introduction A. Background on Climate Change B. Climate Change & Water Resources C. Agriculture & Food Security I. II. Climate Change in the Middle East A. Water Insecurity B. Food Security Situation C. Regional Drought in 2008 III. Research Approach A. Jordan Case Study 2008 Drought B. Climate Change Impact Jordan
BACKGROUND INFO CLIMATE CHANGE Global temperatures expected to rise anywhere between 2.5 and 10 degrees over next century Impact will vary based on world s efforts to reduce greenhouse gas emissions. Source: IPCC, 2014
CLIMATE CHANGE & WATER RESOURCES Increased temperature coupled with decreased water resources. Precipitation likely to decrease a mid-latitudes Left: RCP 2.6 Low Emission scenario Source: IPCC, 2014 Right: RCP 8.5 High Emission scenario
AGRICULTURE AND FOOD SECURITY Majority of studies show negative impact on crop yields with isolated positive effects at high latitudes Graph shows percentage of projections with increases or decreases in yields. Source: IPCC, 2014
CLIMATE CHANGE IMPACT IN THE MIDDLE EAST Middle East already the most water scarce region. Renewable Freshwater Resources per Capita (cubic meters) Latin America & Caribbean North America Europe & Central Asia East Asia & Pacific Climate Change Model predict the Middle East region will become hotter, drier, less predictable (IPCC, 2014). Sub-Saharan Africa Middle East & North Africa 0 5,000 10,000 15,000 20,000 25,000 People in the region most concerned about implications of climate change on drought. REF Source: Stokes et al. 2015
WATER INSECURITY Region already exceeds water necessary to feed population, imports food. Future will see decreased precipitation, massive population growth, and increased demand for irrigation. MENA Population Growth Cereal Balance of Trade (metric tons) 700 647 650 Population in Millions 600 550 54,465 Imports 500 Production 66,818 450 423 400 2015 2020 2025 2030 2035 2040 2045 2050 In order to meet the consumption needs of its population, the Middle East imports over 55% of the grain it consumes. The population of the Middle East and North Africa is expected to increase by 224 million (over 50%) over the next 35 years Source: Arab Organization for Agricultural Development, Arab Agricultural Statistical Yearbook, 2014 Source: United Nations, 2015
2008 REGIONAL DROUGHT Severe drought in 2008 caused widespread water and food insecurity Syria forced to import wheat Rural-Urban Migration Potential Cause of conflict Source: United States Department of Agriculture, 2015
WHY JORDAN? Research will focus on impact of drought in Jordan. Major U.S. Ally Stable country Already one of the most water scarce countries in the world.
RESEARCH QUESTIONS Who is most affected by drought in Jordan? What areas are most impacted by drought? How will climate change impact areas affected by drought?
PRECIPITATION IN JORDAN The majority of precipitation falls during the cooler winter months (Nov Apr) The northeast of Jordan receives much more rain than the rest of the country. Source: Climate Change Knowledge Portal, 2016 Source: Ababsa, Myriam, Atlas of Jordan
AGRICULTURE IN JORDAN Top agricultural commodity - Tomatoes Top agricultural import - wheat. Cropland is concentrated in the northwest where there is greater rainfall. Source: USDA, 2016
POPULATION DISTRIBUTION Source: Ababsa, Myriam, Atlas of Jordan
ANALYSIS Examine the impact of the 2008 drought in Jordan Identify the geographic area and population affected and measure effect on agricultural production. How will future changes in climate affect drought afflicted areas in Jordan (e.g. temperature, precipitation, and consecutive dry days (if possible) in 2050).
DROUGHT ANALYSIS DATA Spatial Resolution Data Source Data Timeframe Description Purpose Measure precipitation for drought period compared to historic average Climate Hazards Group CHIRPS Precipitation 1981-2016 Monthly precipitation dataset from 1981- Present .05 degree Measure level of vegetation for drought period compared to historic average NDVI Vegetation 2000-2016 Vegetation dataset 250 meters MODIS, USGS Tomato Yield, area harvested Identify whether tomato production was impacted by the 2008 drought. Annual production figures for agricultural products 2000-2014 Non-spatial FAO Cereals Yield, area harvested Identify whether cereal production was impacted by the 2008 drought. Annual production figures for agricultural products 2000-2014 Non-spatial FAO Use Gridded Population dataset to estimate the population in drought affected areas Oak Ridge National Library Population 2008 Gridded Population Dataset 1km
2008-2009 PRECIPITATION Jordan - Precipitation between November to April (mm) Regional drought in Middle East also affected Jordan 140 Focus on November to April when most of Jordan s rain falls 120 100 Precipitation (mm) One of the worst drought seasons was in 2008-2009 80 In 2008-2009 Jordan received just 62.7 mm, well below that average of precipitation of 90.5 mm during these months 60 2008- 2009, 62.7mm Precipitation (mm) 40 Average Precipitition 1970-2012 20 1970-1971 1972-1973 1974-1975 1976-1977 1978-1979 1980-1981 1982-1983 1984-1985 Winter Growing Season 1986-1987 1988-1989 1990-1991 1992-1993 1994-1995 1996-1997 1998-1999 2000-2001 2002-2003 2004-2005 2006-2007 2008-2009 2010-2011 Source: The World Bank Group, 2016
2008-2009 TEMPERATURE Temperature during 2008- 2009 growing season was slightly above average. Relationship between temperature and drought is more tepid. Source: The World Bank Group, 2016
EXPECTED RESULTS Map will illustrate areas affected by the 2008 drought, likely in Northwestern Jordan. Based on map of areas affected, spatial analysis will be used to estimate population affected. Overlay drought affected areas and climate change data to determine how areas affected by the drought will fare in future climate scenarios
CLIMATE CHANGE DATA Spatial Resolution Data Source Data Timeframe Description Purpose Average monthly precipitation climate projection for 2050 at 30 second resolution Measure change in precipitation levels under climate change. WorldClim Precipitation 2040-2060 30 seconds WorldClim Measure change in annual mean temperature between 2050 and present WorldClim Precipitation 2040-2060 Annual Mean Temperature 30 seconds WorldClim WorldClim Precipitation 2040-2060 Mean Temperature of Wettest Quarter Measure change in temperature during the wet months 30 seconds WorldClim To measure effects, will take an average of 5 climate change models (TBD) and will use two emissions scenarios RCP 4.5 and RCP 8.5 Scenarios.
TIMELINE Begin Analysis November 2016 Present paper at the AAG Annual Meeting in April 2017.
REFERENCES Al-Qinna, M. I., Hammouri, N. A., Obeidat, M. M., & Ahmad, F. Y. (2011). Drought analysis in Jordan under current and future climates. Climatic Change, 106(3), 421 440. http://doi.org/10.1007/s10584-010-9954-y Altz-stamm, A. (2012). Jordan s Water Resource Challenges and the Prospects for Sustainability. Brown, O., & Crawford, A. (2009). Rising Temperatures , Rising Tensions: Climate change and the risk of violent conflict in the Middle East. Retrieved from https://www.iisd.org/pdf/2009/rising_temps_middle_east.pdf Climate Change Knowledge Portal. (2016). Climate Change Knowledge Portal. Retrieved from http://sdwebx.worldbank.org/climateportal/index.cfm?page=country_historical_climate&ThisCCode=JOR Easterling, W.E., P.K. Aggarwal, P. Batima, K.M. Brander, L. Erda, S.M. Howden, A. Kirilenko, J. Morton, J.-F. Soussana, J. S., & and F.N. Tubiello. (2007). Food, fibre and forest products. Climate Change 2007: Impacts, Adaptation and Vulnerability. Contribution of Working Group II to the Fourth Assessment Report of the Intergovernmental Panel on Climate Change, 273 313. Retrieved from http://www.ipcc-wg2.gov/AR4/website/05.pdf Food and Agriculture Organization. (2014). AQUASTAT. Retrieved from http://www.fao.org/nr/water/aquastat/data/query/results.html Gillis, J. (2015). Short Answers to Hard Questions About Climate Change. Retrieved from http://www.nytimes.com/interactive/2015/11/28/science/what-is-climate-change.html?_r=1 IPCC. (2007). A report of Working Group I of the Intergovernmental Panel on Climate Change Summary for Policymakers Summary for Policymakers. Cambridge University Press. IPCC. (2014a). Climate Change 2014 Synthesis Report Summary Chapter for Policymakers. Ipcc. http://doi.org/10.1017/CBO9781107415324 IPCC. (2014b). Summary for Policymakers. Climate Change 2014: Impacts, Adaptation and Vulnerability - Contributions of the Working Group II to the Fifth Assessment Report. Cambridge University Press. http://doi.org/10.1016/j.renene.2009.11.012
REFERENCES IRIN. (2009). Syria: Drought blamed for food scarcity. Retrieved from http://reliefweb.int/report/syrian-arab-republic/syria- drought-blamed-food-scarcity Jordan Ministry for Water and Irrigation, & German Technical Cooperation. (2004). The national water master plan, 97. Retrieved from http://ocid.nacse.org/rewab/docs/National_Water_Master_Plan_of_2004.pdf Kelley, C. P., Mohtadi, S., Cane, M. A., Seager, R., & Kushnir, Y. (2015). Climate change in the Fertile Crescent and implications of the recent Syrian drought. Proceedings of the National Academy of Sciences, 112(11), 3241 3246. http://doi.org/10.1073/pnas.1421533112 Lesk, C., Rowhani, P., & Ramankutty, N. (2016). Influence of extreme weather disasters on global crop production. Nature, 529(7584), 84 87. http://doi.org/10.1038/nature16467 Luber, G., & McGeehin, M. (2008). Climate Change and Extreme Heat Events. American Journal of Preventive Medicine, 35(5), 429 435. http://doi.org/10.1016/j.amepre.2008.08.021 Min, S.-K., Zhang, X., Zwiers, F. W., & Hegerl, G. C. (2011). Human contribution to more-intense precipitation extremes. Nature, 470(7334), 378 381. http://doi.org/10.1038/nature09763 Ministry of Water & Irrigation. (2013). Jordan Water Sector Facts and Figures 2013 Opening Statement. Retrieved from http://www.mwi.gov.jo/sites/en-us/Documents/W. in Fig.E FINAL E.pdf Olesen, J. E., & Bindi, M. (2002). Consequences of climate change for European agricultural productivity, land use and policy. European Journal of Agronomy, 16(4), 239 262. http://doi.org/10.1016/S1161-0301(02)00004-7 The World Bank Group. (2015). Renewable internal freshwater resources per capita (cubic meters). Retrieved July 31, 2016, from http://data.worldbank.org/indicator/ER.H2O.INTR.PC?end=2014&locations=JO&start=2014&view=map&year_high_desc =true
REFERENCES Stokes, B., Wike, R. & Carle, J., 2015. Global Concern about Climate Change, Broad Support for Limiting Emissions, Available at: http://www.pewglobal.org/2015/11/05/global-concern-about-climate-change-broad-support-for-limiting- emissions/ [Accessed September 5, 2016]. Tubiello, F. N., Soussana, J.-F., & Howden, S. M. (2007). Crop and pasture response to climate change. Proceedings of the National Academy of Sciences of the United States of America, 104(50), 19686 90. http://doi.org/10.1073/pnas.0701728104 United Nations. (2015). World Population Prospects - Population Division - United Nations. World Population Prospects - 2015 Revision. Retrieved from https://esa.un.org/unpd/wpp/ United States Department of Agriculture. (2008). SYRIA : Wheat Production in 2008 / 09 Declines Owing to Season-Long Drought. Retrieved from http://www.pecad.fas.usda.gov/highlights/2008/05/syria_may2008.htm United States Department of Agriculture. (2015). SYRIA: 2015/2016 Wheat Production Up from Last Year due to Favorable Precipitation. Retrieved from http://www.pecad.fas.usda.gov/highlights/2015/07/Syria/Index.htm Worland, J. (2011). Scientists Are Making Stronger Links Between Climate Change and Extreme Weather | TIME. Retrieved from http://time.com/4255428/climate-change-extreme-weather/ World Health Organization. (2016). Climate Change Adaptation to Protect Human Health: Jordan project profile. Retrieved August 8, 2016, from http://www.who.int/globalchange/projects/adaptation/en/index5.html