Introduction to Stata
Powerful data analysis software, including data management, visualization, and statistical analysis. Seminar covers navigating Stata, data import, exploring and visualizing data, basic statistical analysis, and outputting to Word and Excel.
5 views • 126 slides
Interactive Concept Mapping for Data Analysis in Science Education
Explore GLOBE and My NASA data collection through concept mapping. Engage students in visualizing and analyzing data. Activities include cloud types study, data acquisition, assessing accuracy, and data visualization. Suitable for all class formats - online, hybrid, or face-to-face.
1 views • 11 slides
Object-Oriented Analysis and Design Workflow
Object-Oriented Analysis (OOA) is a crucial step in software development to produce a logical model of the system's functionality. It involves requirements analysis, use case analysis, and use case realization to identify classes, responsibilities, attributes, and associations. The process includes
11 views • 90 slides
PATHFINDER LEADERSHIP AWARD SESSION NO.3. Risk Assessment
Explore the crucial aspects of risk assessment, including understanding risks, why it's necessary, when and how to conduct assessments, and who should be involved. Gain insight into visualizing risks and learn about the importance of control measures. Get ready to enhance your leadership skills in m
1 views • 14 slides
Guidelines for Designing Person-Centered Care Pathway Schemas
This document provides a template and writing instructions for creating schemas for person-centered and integrated care pathways. It offers insights on visualizing the steps of a care pathway and emphasizes clear communication in the design process. Contact details are included for further guidance.
6 views • 21 slides
Trouble Visualizing Data_ The Best Dashboard Software Can Change Your Perspective
Dive into the world of the best dashboard software with our latest blog. Find out how the right tools can transform your approach to data visualization, making complex information easily understandable and actionable. We explore how enhancing your data analysis capabilities can lead to improved deci
9 views • 7 slides
Spring 2BL : Lecture 5
In Lecture 5 of the Spring 2BL course with Vivek Sharma, students will delve into probability distributions, confidence levels, and the visualization of data through histograms. The lecture covers topics like calculating the mean and standard deviation, understanding the uncertainty in measurements,
2 views • 28 slides
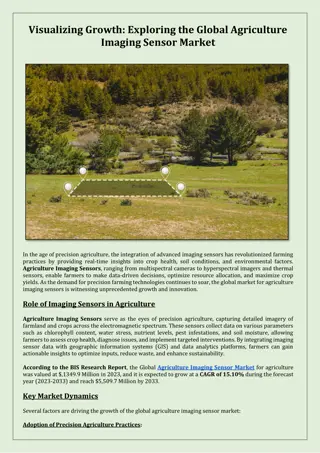
Visualizing Growth: Exploring the Global Agriculture Imaging Sensor Market
According to the BIS Research Report, the Global Agriculture Imaging Sensor Market for agriculture was valued at $,1349.9 Million in 2023, and it is expected to grow at a CAGR of 15.10% during the forecast year (2023-2033) and reach $5,509.7 Million by 2033.
4 views • 3 slides
Guiding Others to Follow Jesus Through Compassion and Care
Tax collectors and sinners gathered around Jesus, sparking criticism from the Pharisees. Jesus teaches the importance of caring for the lost with parables of the lost sheep and coin. We are encouraged to emulate Jesus by visualizing, evangelizing, and prioritizing helping others to follow Him.
0 views • 16 slides
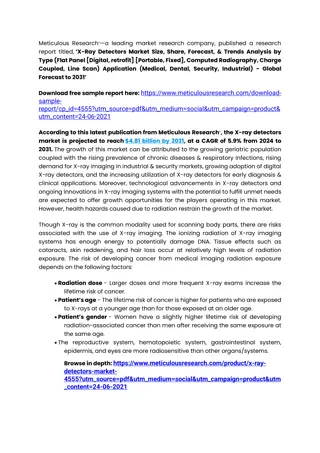
asia pacific x ray detecter
X-ray detectors are devices or systems used to capture and record X-ray images for medical, industrial, scientific, or security purposes. They are essential tools for visualizing the internal structures of objects and organisms through the use of X-ray radiation. X-ray detectors are used in a variet
1 views • 3 slides
xray detecter
X-ray detectors are devices or systems used to capture and record X-ray images for medical, industrial, scientific, or security purposes. They are essential tools for visualizing the internal structures of objects and organisms through the use of X-ray radiation. X-ray detectors are used in a variet
1 views • 2 slides
Visualizing Hurricane Tracks and Severity Over 40 Years
Explore hurricane track data from 1981 to 2021 sourced from the International Best Track Archive for Climate Stewardship. The visualization includes maps showcasing hurricane frequency, maximum severity by Saffir-Simpson scale categories, and trend indices. Follow the evolution of hurricane patterns
0 views • 18 slides
Exploring Poetic Inspiration: Visualizing and Creating Poetry
Delve into the enchanting world of poetry through visual interpretations and creative writing. Experience the magic of crafting verses inspired by imagery, from warm summer nights to tranquil winter scenes, inviting individuals to unleash their inner poet. Swap illustrations and spark poetic genius
0 views • 7 slides
Certification in AutoCAD 2D & 3D Course Overview
AutoCAD 2D & 3D course provides essential skills for drafting, creating, and visualizing designs with ease. The course duration is 1.5 months with a focus on design blending, editing, building layouts, and enhancing 2D/3D models. Topics covered include drawing tools, modification, isometric drawing,
1 views • 6 slides
Understanding the Use of Maps in Public Health
Maps play a crucial role in public health by visualizing health data, trends, and locations of health events. They are used to communicate information such as disease rates, outbreaks, and causal factors. Spot maps show individual case locations, while area maps use colors or shades to communicate t
0 views • 15 slides
Simplified Process Mapping Templates and Shapes
Comprehensive instructions and templates for initiating a process map, with clear shapes for visualizing start decisions, activities, inefficiencies, and more. Includes options for utilizing swim lanes to enhance organization and clarity.
0 views • 4 slides
Understanding Fingerprint Development Techniques
Exploring the development of latent fingerprints through physical and chemical methods, conditions affecting latent prints, and various fingerprint development techniques like visual examination, powder techniques, and chemical techniques. Techniques such as alternate light sources and powder method
2 views • 22 slides
Visualizing Real Numbers on a Number Line by Successive Magnification
Visualization techniques for representing real numbers on a number line through successive magnification are demonstrated step by step. The procedure involves dividing the line into equal parts and zooming in on specific ranges to accurately locate decimal values. This method helps in understanding
0 views • 12 slides
Analyzing Interaction Effects in Composite-Based SEM
Explore the concept of interaction effects in composite-based structural equation modeling (SEM) through topics like the logic of interaction, estimating effects, multigroup analysis, and visualizing effects. Learn about moderators, their role in relationships between variables, and techniques for a
1 views • 23 slides
Geographic Data Visualization in R and QGIS for Malawi Health Analysis
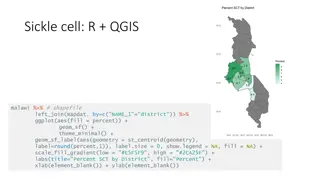
Utilizing R and QGIS, this project focuses on visualizing sickle cell and HIV percentages by district in Malawi, mapping health facility locations, creating Voronoi polygons, and displaying malaria cumulative incidence data. Various geographic data visualization techniques are applied to provide ins
0 views • 8 slides
Understanding 10X Single-Cell RNA-Seq Data Analysis
Explore the intricacies of analyzing 10X Single-Cell RNA-Seq data, from how the technology works to using tools like CellRanger, Loupe Cell Browser, and Seurat in R. Learn about the process of generating barcode counts, mapping, filtering, quality control, and quantitation of libraries. Dive into di
0 views • 34 slides
Bacteria Identification Techniques: Staining and Microscopy Overview
Staining techniques in microbiology play a crucial role in visualizing bacteria under microscopes. This content covers the importance of staining, types of dyes, wet and dry mounts, hanging drop technique, and different types of staining methods employed in identifying bacteria. Explore the basics o
0 views • 39 slides
Exploring Fluorescence Microscopy and High-Speed Cameras in Modern Biology
Delve into the fascinating world of fluorescence microscopy and high-speed cameras in biology through topics such as detectors for microscopy, Nyquist criterion, visualizing hearing in vivo, and temporal resolution insights. Learn about techniques, equipment, and practical considerations in utilizin
1 views • 69 slides
Understanding Descriptive Statistics: A Comprehensive Overview
Descriptive statistics involve organizing and presenting data to extract valuable insights. This overview covers key concepts like populations, samples, variable definitions, types of data, and methods for summarizing information. It also touches on organizing and visualizing data using graphical te
0 views • 48 slides
Understanding Chromosomal Karyotypes: An Overview
Explore the world of chromosomal karyotypes with this detailed guide covering definitions, structures, identification methods, staining techniques, and the importance of karyotyping in genetic analysis. Learn about chromosome labeling, obtaining samples for karyotyping, and the process of arranging
0 views • 12 slides
Utah Valley University - Virtual Reality Implementation for Nanotechnology Education
Utah Valley University (UVU) introduces a nanotechnology course this fall, leveraging VR simulations to train students in nanofabrication and characterization techniques such as photolithography, electron beam lithography (EBL), sputtering, and microscopy. The VR simulations help students familiariz
0 views • 8 slides
Lower Extremity H&P: Foot/Ankle Exam Overview
The lower extremity H&P for foot/ankle examination in orthopedic curriculum involves various steps such as general ortho physical exam maneuvers, inspection for redness and deformities, palpation of specific areas for tenderness and fractures, range of motion assessment, muscle strength testing, and
0 views • 7 slides
Exploring Data Acquisition and Parsing Methods in Data Science
This lecture covers various aspects of obtaining and parsing data, including methods for extracting web content, basic PANDAS commands for data storage and exploration, and the use of libraries like Requests, BeautifulSoup, and PANDAS. The Data Science Process is highlighted, emphasizing the importa
0 views • 42 slides
MATLAB Workshop: Graphs, Runtime Analysis, and Plotting Techniques
MATLAB Workshop Part 3 delves into the creation of 2D and 3D plots, along with advanced plotting commands, runtime analysis using tic and toc functions, and the utilization of the MATLAB profiler. The content demonstrates techniques for plotting multiple curves, creating subplots, and visualizing da
0 views • 22 slides
Exploring Poetry: Analyze, Visualize, and Infer
Dive into the art of analyzing poetry with techniques such as reading and listening for language and rhythm, visualizing imagery, making inferences about themes, and discussing elements like rhyme and stanzas. Engage in activities like using graphic organizers to enhance understanding and appreciati
0 views • 11 slides
Visualizing Lengths: Fun Learning Activities for Students
Experience engaging activities on measuring lengths and distances, comparing familiar objects, estimating lengths, visualizing proportions, and exploring real-world scenarios. The content includes explicit teaching on the length of a blue whale, constructing maps, measuring room dimensions, and fun
0 views • 12 slides
Enhancing Chemistry Education with Augmented Reality Technology
Augmented reality technology offers innovative solutions to overcome barriers in teaching chemistry within the biosciences. By integrating AR tools such as interactive 3D images and simulations, students can explore the micro-world of biomolecules with higher comprehension and engagement. This appro
0 views • 11 slides
Visualizing Land Use Changes in Brevard County, Florida: Historic Images Analysis
Explore a fascinating project by Marnie Sippel, a Penn State University MGIS candidate, focusing on visualizing land use changes in Brevard County, Florida. The project involves studying historic aerial photos from various sources, researching software for analysis, and documenting changes in land u
0 views • 26 slides
Understanding Fingerprint Development Techniques
Latent fingerprints are hidden impressions left by the friction ridges of the skin which require physical or chemical techniques for visualization. Factors affecting latent prints include surface type, touch manner, weather, humidity, perspiration, and suspect care. Techniques such as visual examina
0 views • 22 slides
Unlocking Creativity in Advertising: Strategies and Process Explained
Exploring the significance of creativity in advertising, this content illustrates the innovative capacity in creating impactful campaigns. It covers the importance of fresh ideas, market development, brand loyalty, and the creative process involved in crafting compelling advertisements. From underst
0 views • 20 slides
Visualizing the Future Public Symposium - November 3-5, 2021
Visualizing the Future Public Symposium is a project aimed at developing a literacy-based agenda for library and information professionals focusing on data visualization. Supported by the Institute of Museum and Library Services, this symposium features lightning talks, discussions, an invited speak
0 views • 6 slides
Analytical Techniques in Pharmaceutical Analysis
Analytical techniques play a crucial role in determining the identification and concentration of chemical substances in pharmaceutical analysis. Techniques range from simple gravimetric analysis to sophisticated methods using specialized instrumentation. Various techniques like gravimetric, titrimet
0 views • 17 slides
Advanced Imaging Techniques for Three-Phase Flows in Reactor Systems
Gas-liquid-solid reactor systems require advanced measuring techniques to understand complex three-phase flows. Multi-Phase Flow Decomposition using Electrical Capacitance Volume Tomography (ECVT) offers innovative solutions for visualizing and quantifying phase hold-up distributions and dynamic cha
0 views • 17 slides
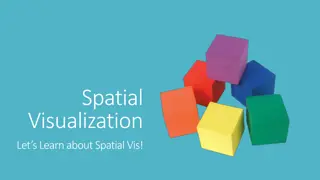
Spatial Visualization Techniques and Isometric Drawings
Explore spatial visualization concepts through activities like rotating shapes, connecting dots in isometric drawings, depicting 3D cubes, and creating coded plans for isometric views. Learn how to draw isometrically, define axes, and align paper for accurate representation. Develop skills in visual
0 views • 29 slides
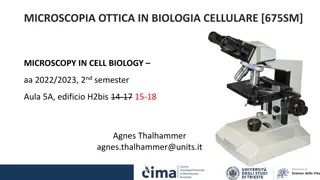
Microscopic Techniques in Cell Biology: Lessons and Labs Overview
Explore the fascinating world of optical microscopy in cellular biology, covering topics such as image formation, contrasting techniques, fluorescence microscopy, live-imaging techniques, and quantitative microscopy. Dive into the principles behind various microscopy techniques and experimental labs
0 views • 7 slides


