
Understanding Software Analysis and Design Process
Software analysis and design involve a systematic approach to understanding user requirements, creating logical models, and transitioning to detailed design specifications. Requirements analysis focuses on capturing system requirements, while design translates these requirements into implementation
6 views • 16 slides
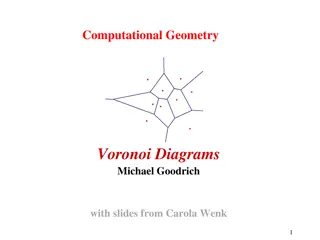
Computational Geometry.
Voronoi diagrams, a key concept in computational geometry, involve partitioning a space based on points sites. They have diverse applications like nearest neighbor queries and facility location. The diagrams consist of Voronoi cells, edges, and vertices, forming a connected graph. Properties include
0 views • 19 slides

Understanding UML Deployment Diagrams
UML Deployment Diagrams show the execution architecture of software systems, illustrating how software deployment targets are assigned artifacts to nodes. Nodes represent hardware devices or software environments connected through communication paths, while artifacts are concrete elements deployed o
1 views • 22 slides

The Joy of Sets: Graphical Alternatives to Euler and Venn Diagrams
Graphical representations of set membership can be effectively portrayed using alternatives to traditional Euler and Venn diagrams. Learn about upset plots, indicating set membership graphically, and the use of Venn or Euler diagrams as solutions. Explore the historical context and challenges with V
2 views • 43 slides
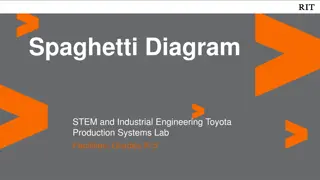
Exploring Spaghetti Diagrams in STEM Education for Grades K-5
Dive into the world of Spaghetti Diagrams through industrial engineering concepts taught in a Toyota Production Systems Lab for students in Grades K-5. Understand the flow of movement in spaces like houses, learn to create spaghetti diagrams, and discover how they can be applied to rearrange rooms a
0 views • 20 slides

Business Mathematics: Various Bar Diagrams and Charts Explained
This comprehensive guide covers the concepts of sub-divided bar diagrams, duo-directional bar diagrams, sliding bar diagrams, and pie charts in Business Mathematics. It includes definitions, examples, and solutions to help understand how to represent data effectively using these graphical tools. Ms.
0 views • 15 slides

Network Diagrams for Resource Management Techniques
Examples of network diagrams and arrow diagrams for different relationships in resource management techniques are provided. The diagrams illustrate activity sequences, dependencies, and solutions for various scenarios. These visual representations aid in planning, scheduling, and managing resources
1 views • 6 slides

Math Quiz and Venn Diagrams
Venn diagrams for sorting numbers, probability calculations, the concept of angles in straight lines, and various math questions including factors, multiples, ratios, and conversion between 12-hour and 24-hour clocks are discussed in this educational content. The content also illustrates scenarios w
0 views • 25 slides

Evolution of Modeling Methodologies in Telecommunication Standards
Workshop on joint efforts between IEEE 802 and ITU-T Study Group 15 focused on information modeling, data modeling, and system control in the realm of transport systems and equipment. The mandate covers technology architecture, function management, and modeling methodologies like UML to YANG generat
0 views • 16 slides
Understanding UML Sequence Diagrams and Their Applications
UML sequence diagrams depict how objects interact in a given scenario, showcasing messages sent between targets on lifelines. They are valuable for detailing use cases, modeling logic, task flow between components, and understanding process functionality. Objects, boundaries, controls, and stereotyp
1 views • 30 slides
Understanding System Modeling in Engineering
System modeling in engineering involves developing abstract models to represent a system from various perspectives using graphical notations like UML. These models aid in understanding system functionality, communicating with stakeholders, and documenting requirements for new systems. Existing and p
1 views • 53 slides

Understanding Structured Analysis in Software Design
Structured analysis in software design aims to describe customer requirements, create a basis for software design, and define validatable requirements. Two main modeling philosophies, structured analysis, and object-oriented analysis are discussed. Structured Analysis Model Elements such as Data Flo
1 views • 44 slides

Interactive Lesson on Venn Diagrams and Shading Regions
Dive into a comprehensive tutorial on Venn diagrams highlighting the process of populating and shading regions. Access engaging resources, visual aids, and practice exercises to enhance your understanding. Test your knowledge with a quiz on Hegarty Maths and solidify your skills in displaying sets w
0 views • 15 slides

Understanding Object Behaviors and Statechart Diagrams in Software Design
Object behaviors and UML statechart diagrams play a crucial role in software requirements and design. State machines, transitions, events, and states are essential concepts in modeling object behavior in response to external events. By utilizing UML statechart diagrams, one can effectively represent
0 views • 23 slides
Understanding Sets with Venn Diagrams in Junior Certificate Ordinary Level Mathematics
Dive into the world of sets and Venn diagrams with this educational content designed for Junior Certificate Ordinary Level students. Explore shading regions, identifying subsets, and solving problems using Venn diagrams to enhance your mathematical skills.
1 views • 28 slides
Understanding Functions: Definitions and Arrow Diagrams
Recall the definition of a function, where each element in the domain is related to exactly one element in the co-domain. Arrow diagrams can visually represent functions from finite sets X to Y. In this example, a function is defined from X = {a, b, c} to Y = {1, 2, 3, 4} using arrow diagrams, showc
7 views • 28 slides

Understanding Energy Transfers with Sankey Diagrams
Sankey diagrams are visual tools that depict energy transfers within a system, offering insights into efficiency and energy distribution. By examining the width of arrows representing energy flow, one can analyze useful and wasted energy outputs. Inefficient systems show a disproportionate amount of
1 views • 9 slides

Understanding Feynman Diagrams in Particle Physics
Feynman diagrams, developed by Richard Feynman in the 1940s, are a graphical technique to represent particle interactions in space-time. These diagrams use lines to depict particles, with fermions moving forward in time and antifermions moving backward. Vertices in the diagrams represent points wher
1 views • 19 slides

Water Management Plans for Healthcare Facilities - Process Flow Diagrams
Editable water system process flow diagrams for healthcare facilities based on recommendations from CDC and ASHRAE. Includes instructions for customization and samples for various water flow scenarios. Ensures facilities can create customized diagrams tailored to their specific needs for effective w
1 views • 7 slides

System Sequence Diagrams: Understanding Artifact for System Behavior
System Sequence Diagrams (SSDs) are vital artifacts that visually illustrate input and output events related to a system. They help define system behavior and interactions, making them essential during the logical design phase of software applications. By depicting events in sequential order, SSDs o
2 views • 24 slides
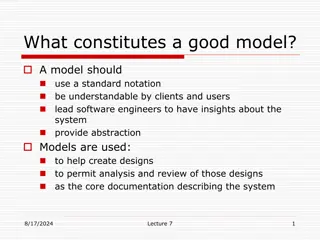
Understanding UML for Effective Software Design
A good model should utilize standard notation, be easily understandable, and provide insights for software engineers. UML features, essentials of UML class diagrams, and details on classes, associations, and multiplicity are covered. The objective is to assist in software development through abstrac
3 views • 48 slides

Understanding Conceptual and Requirement Modelling Using UML
Enterprise and system models play a crucial role in the business world. This collection of images showcases various aspects of conceptual and requirement modelling using Unified Modelling Language (UML). From business process models to human interactions with software systems, these visual represent
1 views • 92 slides
Exploring Argument Structure and Diagramming in Critical Reasoning
Understanding the two types of argument structures - atomic and complex, with examples and diagrams. Learn how argument diagrams visually represent the structure of an argument, identify significant units like premises and conclusions, and distinguish main conclusions from sub-conclusions. Dive into
1 views • 10 slides
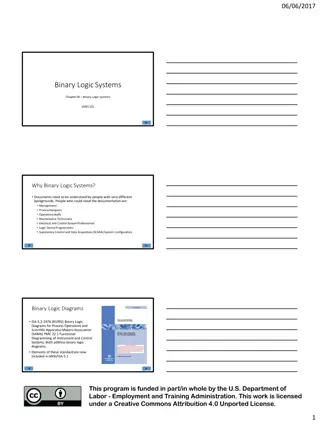
Understanding Binary Logic Systems in Documentation
Binary logic systems play a crucial role in documentation for individuals with diverse backgrounds such as management, process designers, operations staff, maintenance technicians, and more. These systems, depicted in binary logic diagrams, provide a clear and concise representation for various prof
4 views • 16 slides
Understanding System Diagrams: An Overview
Visual representations play a crucial role in understanding complex systems. System diagrams and models provide a simplified view of reality for better comprehension, analysis, and communication among stakeholders. Explore the importance, types, and uses of system diagrams through various examples a
0 views • 11 slides
Understanding Forces and Free Body Diagrams in Physics
Explore the concepts of forces, dynamics, and free body diagrams in physics. Learn about different types of forces, how to draw free body diagrams, calculate net force, and solve example problems involving forces and motion.
0 views • 11 slides

Overview of Loop Diagrams in Process Control Systems
Loop diagrams are essential documents in process control systems, providing schematic representations of hydraulic, electric, magnetic, or pneumatic circuits. They detail instrumentation arrangements, signal connections, power connections, and termination information. Guidelines and standards for cr
1 views • 5 slides
Comprehensive Guide to Loop Diagrams in Process Control Systems
Loop diagrams are essential documents in process control systems, depicting hydraulic, electric, magnetic, or pneumatic circuits. This comprehensive guide covers loop diagram definitions, components, guidelines, development stages, and instrument connection symbols. It explains what loop diagrams en
0 views • 13 slides

Various Quality Improvement Diagrams for Root Cause Analysis
Explore a series of quality improvement diagrams such as fishbone diagrams, cause-and-effect flow charts, error reduction improvement diagrams, and root cause analysis steps. These visual tools offer insights into identifying and addressing root causes of issues in different processes or systems.
0 views • 12 slides

Key Driver Diagrams in Continuous Quality Improvement
Key Driver Diagrams are essential tools in Continuous Quality Improvement (CQI) to help organizations achieve their goals by identifying key drivers and their relationships. These diagrams aid in understanding complex systems, setting SMART aims, and implementing effective change strategies. Through
0 views • 24 slides
Understanding UML Sequence Diagrams
UML Sequence Diagrams illustrate high-level interactions between class instances in software programs. They represent method calls and interactions among objects during program execution. The diagrams show interactions for specific circumstances like startup or button clicks. Each class/object is re
0 views • 8 slides
Understanding Force Diagrams and Balanced/Unbalanced Forces
Explore the concepts of force diagrams, balanced forces, and unbalanced forces through visual examples and explanations. Learn how balanced forces keep objects stationary or at a constant speed, while unbalanced forces cause movement and changes in direction. Practice calculating resultant forces an
1 views • 11 slides
Understanding Hasse Diagrams in Linear Models for Professional Bowlers Association Qualifying Scores
This study explores the application of Hasse diagrams in analyzing linear models for the 2006 Professional Bowlers Association qualifying scores. It delves into the structure of the tournaments, oil patterns used, replicational design, and interactions between factors. The diagrams help visualize th
0 views • 14 slides

Understanding Activity Diagrams and State Chart Diagrams
Activity diagrams describe the workflow behavior of a system by showing the sequence of activities performed, including conditional and parallel activities. Elements such as Initial Activity, Symbol Activity, Decisions, Signals, Concurrent Activities, and Final Activity are depicted in these diagram
0 views • 10 slides

Understanding UML Package Diagrams and Components in Software Design
UML package diagrams are essential in organizing model elements such as use cases and classes into groups for a better structure in system modeling. They help in providing a high-level overview of requirements and architecture, logically modularizing complex diagrams, and indicating dependencies bet
0 views • 38 slides
Understanding Activity Diagrams in Object-Oriented Modeling
Activity diagrams in object-oriented modeling show the sequence of steps in a complex process, such as an algorithm or workflow. They depict the flow of control, including sequential and concurrent paths. These diagrams are essential during the early stages of designing algorithms and workflows, ill
0 views • 13 slides

Understanding Testing in Software Engineering
In the previous session, we discussed various aspects of software engineering, including modeling with UML diagrams, such as activity diagrams, use case diagrams, sequence diagrams, state diagrams, and class diagrams, as well as architecture patterns. Testing was emphasized as a key aspect, highligh
0 views • 35 slides
Understanding Object-Oriented Programming Concepts in Java
Clear up confusion on method order, printing variables from other classes, use of "this.xxx," dealing with unnecessary decimal points, object vs. address understanding, syntax preferences, calling methods, private vs. public methods, return types in UML diagrams, and other key OOP concepts.
0 views • 13 slides
Comparing EER and UML Architecture for Modelling of MIS
This discussion delves into the comparison between Entity-Relationship (EER) and Unified Modeling Language (UML) architectures for the modelling of Management Information Systems (MIS). It explores the differences in notation, methodological considerations, specialisation hierarchies, and categorisa
0 views • 16 slides

Understanding UML Activity Diagrams in Software Design
UML Activity Diagrams provide a modern way to visualize business processes, workflows, data flows, and complex algorithms in software systems. They use symbols to represent different parties involved, actions performed, transitions, and control flows. These diagrams help in modeling data flows, obje
0 views • 14 slides