Add Factors and Forecasting in Regression Analysis
Regression analysis involves estimating parameters and fitting lines to data, with errors represented by residuals. Errors in forecasting can be caused by structural breaks or one-off events like droughts, leading to growth shifts. Add factors represent the difference between a statistical forecast
1 views • 15 slides

Curve Fitting Techniques
Curve fitting involves approximating function values using regression and interpolation. Regression aims to find a curve that closely matches target function values, while interpolation approximates points on a function using nearby data. This chapter covers least squares regression for fitting a st
1 views • 48 slides

Add Factors and Forecasting in Regression Analysis
Regression analysis involves factors such as estimated parameters, fitted lines, residuals, and errors. Errors in forecasting can be influenced by unobserved variables or random events, leading to deviation from purely statistical forecasts. Add factors represent the difference between actual and co
2 views • 15 slides
Least-Squares Regression Line in Statistics
The concept of the least-squares regression line is crucial in statistics for predicting values based on two-variable data. This regression line minimizes the sum of squared residuals, aiming to make predicted values as close as possible to actual values. By calculating the regression line using tec
1 views • 15 slides

Functional Measurement Systems Analysis for Curve Data Using Random Effects Models
Measurement Systems Analysis (MSA) is crucial in determining the contribution of measurement variation to overall process variation. When dealing with curve data instead of single points, a Functional MSA approach using random effects models can be applied. This involves estimating mean curves, mode
0 views • 5 slides

Regression Diagnostics for Model Evaluation
Regression diagnostics involve analyzing outlying observations, standardized residuals, model errors, and identifying influential cases to assess the quality of a regression model. This process helps in understanding the accuracy of the model predictions and identifying potential issues that may aff
2 views • 12 slides
Testing Residuals for Model Appropriateness in ARMA Modeling
This content discusses the importance of checking residuals for white noise in ARMA models, including methods like sample autocorrelations, Ljung-Box test, and other tests for randomness. It also provides examples of examining residuals in ARMA modeling using simulated seasonal data and airline data
0 views • 40 slides

Regression Lines for Predicting English Scores
Learn how to utilize regression lines to predict English scores based on math scores, recognize the dangers of extrapolation, calculate and interpret residuals, and understand the significance of slope and y-intercept in regression analysis. Explore the process of making predictions using regression
0 views • 34 slides

Examples of Data Analysis Techniques and Linear Regression Models
In these examples, we explore data analysis techniques and linear regression models using scatter plots, linear functions, and residual calculations. We analyze the trends in recorded music sales, antibiotic levels in the body, and predicted values in a linear regression model. The concepts of slope
1 views • 11 slides

Advanced Analysis of SAGE III Limb Scatter Retrievals
The proposed effort focuses on enhancing LaRC operational retrieval codes for SAGE LS data, correcting Level 1 radiances, and recommending LS operational scenarios. OMPS LS retrieval algorithms for aerosol and ozone, as well as the SAGE/M3 LS ozone retrieval approach, are detailed. Out-of-field stra
0 views • 12 slides
Analysis of Resolution and Residuals in Experimental Data
This document presents an analysis of experimental data including resolution figures, residuals from fitting, and positional jitter. It explores single point analysis, charge references, and resolution as a function of sample number. The data is thorough and detailed, providing insights into the acc
0 views • 13 slides
Quadratic and Exponential Models for Curved Relationships
Explore fitting models to curved relationships in statistics, using quadratic and exponential models to analyze two-variable data. Learn how to calculate, interpret residuals, and determine the most appropriate model through residual plots. Discover applications in various fields, such as sports sta
0 views • 19 slides
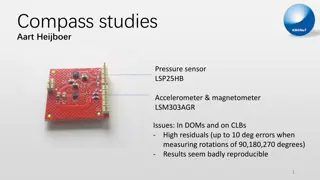
Issues with Magnetometer in Compass Studies - Analysis and Solutions
This document discusses issues encountered in compass studies relating to the performance of the LSM303AGR magnetometer, including high residuals and reproducibility challenges. It highlights the comparison with the LSM303D device, implementation of offset corrections, and the use of Raspberry Pi fo
1 views • 17 slides
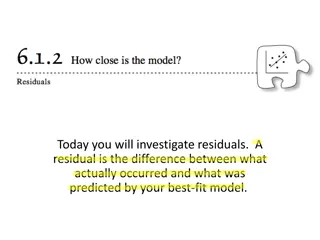
Investigating Residuals in Packaging Experimentation
Explore the concept of residuals by analyzing a cereal packaging experimentation conducted by Battle Creek Cereal. Understand how residuals indicate the variance between actual and predicted values. Delve into scenarios where residuals are large or small, interpreting their significance in practical
0 views • 9 slides

Multiple Regression Analysis of Energy Consumption in Luxury Hotels - Hainan Province, China
Conducting a multiple regression analysis on the energy consumption of luxury hotels in Hainan Province, China using matrix form in Excel. The dataset includes 19 luxury hotels with the dependent variable being energy consumption (1M kWh) and predictors such as area, age, and effective number of gue
0 views • 13 slides
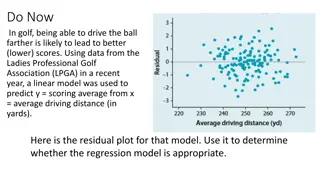
Analyzing Residual Plots for Regression Model Appropriateness in Golf
Utilizing residual plots to evaluate the appropriateness of a linear regression model predicting scoring average from average driving distance in golf based on LPGA data. Introduction to quadratic and exponential models, with an example exploring the relationship between braking distance for motorcy
0 views • 15 slides

Linear Regression Analysis: Testing for Association Between X and Y Variables
The provided images and text explain the process of testing for association between two quantitative variables using Linear Regression Analysis. It covers topics such as estimating slopes for Least Squares Regression lines, understanding residuals, conducting T-Tests for population regression lines,
1 views • 26 slides

Inter-Comparison Exercise on Nuclear Explosion Signal Screening
The 1st Nuclear Explosion Signal Screening Open Inter-Comparison Exercise in 2021 involved participants from various institutions worldwide to evaluate the detection power of anomalous measurements related to nuclear explosions. The exercise included processing a test data set with different scenari
0 views • 16 slides

Electrostatic Distortion Studies at SINP Kolkata and DESY
Studies on electrostatic distortion were conducted at SINP Kolkata and DESY, focusing on a Large Prototype TPC experiment with Bulk Micromegas modules. The experiments included varying electron beam energies, gas mixtures, cosmic ray data collection, drift velocity estimation, and more. Distortions
0 views • 7 slides
Analyzing SAT Mathematics and Critical Reading Scores
This content covers a regression analysis between SAT Mathematics and Critical Reading scores, including calculating the regression line, predicting scores, identifying outliers, interpreting residuals, slopes, and y-intercepts, and assessing the relationship between exercise habits and fast-food co
0 views • 15 slides

Environmental Remediation Using Silica/Silicates for Contaminant Oxidation
Utilizing silica and silicates as chemical oxidants in environmental remediation has been approved under the general WDR permit since 2010. With over 1,500 applications in the US and Canada, including 148 in California, these substances are known for their safety and effectiveness in contaminant oxi
0 views • 8 slides
Introduction to Statistics for the Social Sciences: Lecture Highlights and Regression Example
This material covers key points from a statistics course for the social sciences, including lecture schedule, readings, and concepts such as residuals, simple regression, correlation, and coefficients. Additionally, a regression example involving predicting sales based on sales calls is presented.
0 views • 41 slides

Overview of Physical Flow Accounts and Supply-Use Tables in Economic Analysis
Physical flow accounts play a crucial role in understanding the movement of resources between the environment and the economy. The seminar discussed the scope, purpose, and formation of physical flow accounts based on monetary supply and use tables. It highlighted the importance of widening the dime
0 views • 11 slides
Linear Regression Diagnostics
The essential conditions for a valid least squares line in linear regression, including linearity, nearly normal residuals, and constant variability. Learn how to assess linearity through scatterplots, evaluate residuals' normality using histograms or Q-Q plots, and understand the anatomy of residua
0 views • 15 slides

Residual Analysis in Model Selection
Residual analysis is a crucial step in model selection and validation. It involves examining the differences between observed and predicted values, known as residuals, to detect model misspecification, unequal variances, non-normality, outliers, and correlated errors. By utilizing residuals, we can
0 views • 26 slides
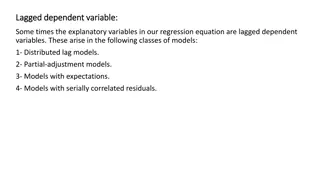
Lagged Dependent Variable Models in Regression Analysis
Lagged dependent variables are utilized in various regression models such as distributed lag models, partial-adjustment models, models with expectations, and models with serially correlated residuals. By incorporating lagged dependent variables, researchers can analyze the impact of past values on t
0 views • 11 slides

Temporal Correlation in Statistical Modeling
Statistical models require independent observations, as dependent observations can lead to low p-values and narrow confidence intervals. Generalized and mixed GAM models are used when there is temporal or spatial autocorrelation between observations. Correlation in time series can be analyzed using
0 views • 48 slides

Regression Lines and Predictions
In this lesson, learn how to make predictions using regression lines, interpret residuals, and understand the importance of a regression line in data analysis. Explore the calculation and interpretation of a residual, the slope and y-intercept of a regression line, and how to determine the equation
0 views • 16 slides

Equilibrium Displacement Model Forecasting
Forecast changes in price, quantity demanded, and quantity supplied using elasticities of demand and supply. This method relies on small changes in exogenous variables to predict the dependent variable reliably. Information required includes baseline quantities and prices, own and cross elasticities
0 views • 20 slides

Linear Regression Model: Fundamental Assumptions and Parameter Estimation
The linear regression model for chemical engineers involves using vectors x and Y as inputs to estimate regression parameters. The model assumes independent, normally distributed errors and aims to find linear relationships between variables. Explore parameter estimation techniques, handling residua
0 views • 21 slides

Update on 2019 State Directors Meeting
The 2019 Spring State Directors Meeting featured updates from various divisions within the US EPA, including Resource Conservation and Restoration, Enforcement and Compliance, RCRA Cleanup and Brownfields, and Materials and Waste Management. The meeting covered accomplishments, goals, and initiative
0 views • 8 slides
Understanding Spatial Correlation of Spectral Accelerations
Ground-motion intensities during earthquakes show spatial correlation with significant implications for risk analysis of distributed systems like buildings and infrastructure. This study focuses on estimating spatial correlation using simulated ground motions from the 1999 Chi-Chi earthquake, provid
0 views • 18 slides
Single Point Hall Probe Studies in SHMS for Scaling SHMS Golden Tune
Discover the status of single point Hall probe studies in SHMS, focusing on the motivation to scale the SHMS Golden Tune and taking Q2 data to ensure reproducibility and accuracy. Learn about the good news regarding Q2 and uncorrected Q2 field residuals.
0 views • 10 slides

Impact of Non-Tidal Station Loading on LLR Observatories and EOP Estimation
Explore the impact of Non-Tidal Station Loading (NTSL) on Lunar Laser Ranging (LLR) observatories and the estimation of Earth Orientation Parameters (EOPs). Discover how NTSL affects LLR residuals, station coordinates, and annual signals. Gain insights into the improvements in LLR observations with
1 views • 8 slides
Understanding Regression Algebra and Fit in Econometrics with Professor William Greene
Explore the intricacies of regression algebra and fit in Econometrics with insights from Professor William Greene at Stern School of Business. Learn about Stata, R-squared, FE models, total sum of squares, minimizing squared residuals, and more vital concepts.
0 views • 37 slides