Equilibrium Displacement Model Forecasting
Forecast changes in price, quantity demanded, and quantity supplied using elasticities of demand and supply. This method relies on small changes in exogenous variables to predict the dependent variable reliably. Information required includes baseline quantities and prices, own and cross elasticities, price flexibilities, and residuals from trend.
Download Presentation

Please find below an Image/Link to download the presentation.
The content on the website is provided AS IS for your information and personal use only. It may not be sold, licensed, or shared on other websites without obtaining consent from the author.If you encounter any issues during the download, it is possible that the publisher has removed the file from their server.
You are allowed to download the files provided on this website for personal or commercial use, subject to the condition that they are used lawfully. All files are the property of their respective owners.
The content on the website is provided AS IS for your information and personal use only. It may not be sold, licensed, or shared on other websites without obtaining consent from the author.
E N D
Presentation Transcript
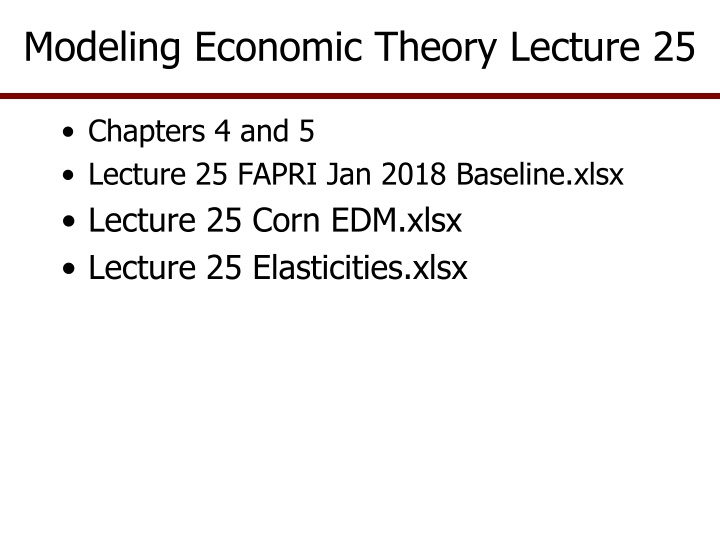
Modeling Economic Theory Lecture 25 Chapters 4 and 5 Lecture 25 FAPRI Jan 2018 Baseline.xlsx Lecture 25 Corn EDM.xlsx Lecture 25 Elasticities.xlsx
Equilibrium Displacement Model Forecasting Elasticities of demand and supply can be used to forecast changes in price, quantity demanded, and quantity supplied Small changes in the exogenous variables allows one to forecast the dependent variable This method is simple and reliable for small changes from equilibrium Information needed: A Baseline or history of equilibrium quantities and prices Own and cross elasticities for demand and supply Price flexibilities Residuals from trend (or a structural model) for the dependent variable if the forecast is to be stochastic
Supply and Use Baseline for a Crop Baseline prices and quantities are available from FAPRI, USDA, Congressional Budget Office (CBO) and some private consulting firms Here is an example of the corn S&U from the FAPRI January 2018 Baseline
Elasticities Planted Acres Elasticities Acreage by Crop Corn Sorghum Wheat Soybeans Cotton Rice Corn Price Wheat Price -0.025 Soybean Price -0.112 Cotton Price -0.034 Rice Price Sorghum Price Barley Price 0.264 -0.04 -0.224 -0.047 0.423 -0.009 -0.019 -0.028 0.259 -0.054 -0.095 0.031 -0.046 0.462 -0.068 -0.004 -0.084 -0.1 -0.081 -0.003 0.405 Domestic Demand Elasticities Domestic Quantity Demanded by Crop Corn Feed Food Alcohol HFCS Ending Stocks Soybean Meal Price Corn Price Wheat Price Soybean Price Cotton Price Rice Price Sorghum Price Barley Price Oat Price -0.316 -0.16 -0.081 -0.333 -0.612 0.073 0.179 0.035 0.015 0.01 Wheat Feed Food Ending Stocks 1.346 -2.965 -0.125 -0.7229
Order of Equations for Supply Yield = f(max(lagged prices, policy variable)) Lagged prices for own crop and competing crops Planted Acres = f(f(max(lagged prices, policy variable)) Lagged prices for own crop and competing crops Harvested Acres = fraction * planted acres Production = harvested acres * yield Supply = production + beginning stocks
Order of Equations for Demand Price = f( supply ) Domestic demand = f(own price ) Exports = f(own price ) Total Use = domestic demand + exports Ending stocks = supply total use
Equilibrium Displacement Model -- Yield Yield per acre for an assumed change in price Yield/AcreC= YldB* [1 + {Es*(( PC- PB) / PB)} ] + Elasticity Supply of Acres X = ((% Acres X) / (% Price X) Price Yield P1 P B Yield for year t QB QC PB and YldBare baseline values PCis an assumed change in price for period t or a stochastic forecast of pricse
Equilibrium Displacement Model -- Acres Acres Planted from the Baseline given a change in price Planted AcresC = PAB * [1 + {Es *(( PC - PB) / PB) } ] + Price Acres Planted P1 PB Acres in year t QB QC PB and QB are baseline values PC is assumed change in price for the current period of a stochastic forecast
Equilibrium Displacement Model -- Supply We can expand the planted acres response equation by including cross elasticities Planted Acres Crop XC = Planted AcresXB * (1 + {[EXS *((PXC - PXB) / PXB)] + [EXsYp *((PYC - PYB) / PYB)] + [EXsZp *((PZC - PZB) / PZB)] } ) + Where: X is the own crop (say, corn), Y is soybeans, and Z is wheat Note: EX,Yp is the cross elasticity of corn acres with respect to the price of soybeans, or more specifically EXCorn,PSoybean = (% Corn Acres) / (% Soybean Price) The planted acres equation can be expanded to contain cross elasticities for all other crops
Continue Equations for Supply Harvested Acres = fraction * planted acres Production = harvested acres * yield Supply = production + beginning stocks + imports After harvest the quantity supplied is fixed for a year Beginning stocks are equal to ending stocks for the previous year Imports are generally insignificant for US crops
Equilibrium Displacement Model -- Price To forecast a price change given a change in quantity supplied PriceC = PB * [1+ {Price Flex *((QC - QB) / QB) } ] + Price Price Flexibility for Crop X = ((% Price X) / (% Price X) ?PC PB Demand Q/UT QB QC PB and QB are baseline values QC is simulated
Equilibrium Displacement Model -- Demand To forecast quantity demanded the equation for crop X is: QDXC =QDXB *(1 + {EDX * ((PC - PB) / PB)}) + Use the same formula for domestic use and exports, we just change the elasticity and the base Qt Price Demand Elasticity for Crop X = ((% Qt D. X) / (% Price X) PB PC Domestic or Export Demand Q Demanded/UT QB QC
Equilibrium Displacement Model Forecasting This method of forecasting is widely used in agricultural economics Particularly useful for policy analysis and consulting This is why economists place so much emphasis on estimating unbiased elasticities
Source of Elasticities USDA has published a review of literature for elasticities and provide an APP for searching the data base https://www.ers.usda.gov/data- products/commodity-and-food-elasticities/ https://data.ers.usda.gov/reports.aspx?ID=17825
Supply and Use Baseline for All Crops and Livestock on FAPRI Website https://www.fapri.missouri.edu
Steps for Developing and Using an EDM First step is to draw the economic construct for the problem at hand From the chart determine what is known and what elasticity you need to calculate or find Y Supply, Acres or Yield Individual Domestic Use or Export Demand X
Steps for Developing and Using an EDM Locate the baseline for the endogenous and exogenous variables or use last year s actual data Must have the following variables Base value for the Endogenous variable (Y) Base and calculated values for variables (Xi) that affect Endogenous variable Elasticities that relate the Y and the Xi s Calculated X values can be stochastic forecasts YCal = YBase * {1+ (% Y/% X) * [(XCal XBase) / XBase] } Reason this formula works is: % Y * (XC-XB) = % Y * % X % X XB % X Or in words this formula is simply % Y = Elasticity YwrtX * Percentage Change in X
Steps for Developing and Using an EDM Regarding including Cross elasticities Include as many cross elasticities as possible in addition to the own elasticity to capture complement and substitute effects YCal = YBase * {1+ (% Y/% X) * [(XCal XBase) / XBase] + (% Y/% Z) * [(ZCal ZBase) / ZBase] } The absolute sum of the cross elasticities should not exceed the own elasticity assuming homogeneity of 1.0 % Y = (Elasticity YwrtXI * Percentage Change in XI) Own and Cross Planted Acres Supply Elasticities for Corn Planted Acres Own Elast Wheat Soybean 0.2640 -0.0250 -0.1120 Sum Cross E -0.1710 Cotton -0.0340
Steps for Developing and Using an EDM If we keep the elasticity formula in mind we can solve many economic questions such as How will planted acres change if price decreases 10% How will exports change if price increases 5% How will imports change a 25% tariff is implemented How will price change if supply is reduced 20% How much fertilizer will be demanded if .. How will acres change if reference price decreased 10% How will corn for ethanol change if corn price incresaes Y X
Steps for Developing and Using an EDM A final note on EDM when forecasting equilibrium price Instead of an elasticity we use a price flexibility PXCal = PXBase * {1+ (% PX/% X) * [(XCal XBase) / XBase] } Reason this formula works is: % P * (XC-XB) = % P * % X % X XB % X Or in words this formula is simply % PX = Flexibility PwrtX * Percentage Change in X
