Understanding Indifference Curve Analysis in Economics
Indifference curve analysis in economics involves examining consumer preferences through the representation of various utility levels achieved from different combinations of goods. By combining indifference curves with budget constraints, optimal consumption bundles can be determined. The analysis i
0 views • 25 slides
Understanding Shifts in Demand Curve
This lesson explores factors that can cause a demand curve to shift, defining terms like Ceteris Paribus and identifying factors influencing demand. Shifts in the demand curve and examples of price influences are discussed, emphasizing the impact of factors beyond price on consumer behavior.
0 views • 16 slides

Understanding Strength-Duration (SD) Curve: A Neuromuscular Diagnostic Test
Strength-Duration (SD) curve is a diagnostic test assessing neuromuscular integrity by measuring the relationship between stimulus strength and duration. It helps in electro-diagnosis of peripheral nervous system disorders and evaluates nerve degeneration and regeneration. The curve is obtained by p
2 views • 17 slides

Understanding Traffic Lane Width Variation in Curve Bridge Design
In curve bridge design, traffic lane width may vary, requiring proper consideration of surface lanes for defining traffic lanes. Non-square elements, like triangular plates, may be used at deck ends due to geometric limitations. Different mesh local axes may be needed for square and non-square eleme
0 views • 15 slides

Learning Reminder: Murdock's Serial Position Curve Study and Experimental Practice
Explore the insights of Murdock's serial position curve study and its applications in experimental psychology. Dive into the concepts of alternate and null hypothesis, Sensory Register, and memory experiments. Engage in practical learning through experiment time activities and visual aids like patch
0 views • 76 slides

Experimental Method to Draw B-H Curve Using Ballistic Approach
Conducting an experiment to draw a B-H curve using the ballistic method involves a setup with primary and secondary windings, a ferromagnetic specimen, and various circuit components. By passing a current through the primary coil and measuring the induced emf in the secondary circuit, the relationsh
0 views • 16 slides
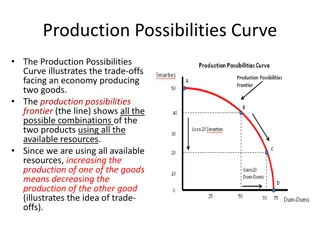
Understanding Production Possibilities Curve and Economic Growth
The Production Possibilities Curve illustrates trade-offs in an economy producing two goods, showing possible combinations using available resources. Efficiency on the curve means no way to make some better off without others worse off. Opportunity cost is the given-up production when increasing one
0 views • 5 slides
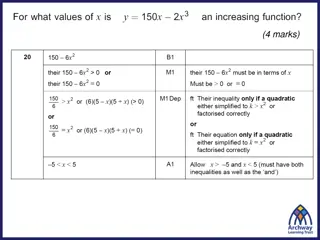
Understanding Points of Inflection in Calculus
Points of inflection in calculus refer to points where the curve changes from convex to concave or vice versa. These points are identified by observing changes in the curve's concavity, and they are not always stationary points. A stationary point can be a point of inflection, but not all points of
0 views • 14 slides

Understanding the Change Curve Model: A Tool for Managing Change
The Change Curve Model, developed by Elisabeth Kubler-Ross, helps individuals navigate the stages of change by addressing denial, anger, bargaining, depression, and acceptance. This model provides a framework to understand different reactions to change and offers strategies to support individuals th
0 views • 4 slides

Item Characteristic Curve Presentation by Chong Ho Alex Yu
Presentation slides showcasing the item characteristic curve by Chong Ho and Alex Yu. The slides contain detailed information and visuals related to the curve, providing a comprehensive overview of its characteristics and analysis. Each slide presents key insights and data points in a visually engag
0 views • 37 slides

Understanding Curve Fitting Techniques
Curve fitting involves approximating function values using regression and interpolation. Regression aims to find a curve that closely matches target function values, while interpolation approximates points on a function using nearby data. This chapter covers least squares regression for fitting a st
0 views • 48 slides

Understanding Monetary Policy Effectiveness in the IS-LM Framework
The relative effectiveness of monetary policy in influencing investment, employment, output, and income depends on the shape of the LM curve and the IS curve. A steeper LM curve signifies higher effectiveness as it indicates less interest elastic demand for money, resulting in significant changes in
0 views • 24 slides

Genetic Manipulation in Environmental Biotechnology
Genetic manipulation strategies in environmental biotechnology involve techniques like gene splicing and molecular cloning to modify genes directly. These methods have various applications such as isolating genes, producing specific molecules, improving biochemical production, creating organisms wit
0 views • 20 slides

Understanding the Kinked Demand Curve Model in Oligopoly
The kinked demand curve model in oligopoly, developed by Paul M. Sweezy, highlights stability in pricing and output decisions among firms. This model suggests that rival firms may react asymmetrically to price changes, leading to a kink at a certain price level. Assumptions include few firms produci
3 views • 7 slides

Functional Measurement Systems Analysis for Curve Data Using Random Effects Models
Measurement Systems Analysis (MSA) is crucial in determining the contribution of measurement variation to overall process variation. When dealing with curve data instead of single points, a Functional MSA approach using random effects models can be applied. This involves estimating mean curves, mode
0 views • 5 slides
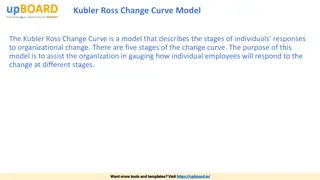
Understanding Kubler Ross Change Curve Model for Organizational Change
The Kubler Ross Change Curve Model delineates five stages - Decision, Denial, Frustration, Depression, and Experiment - illustrating individual responses to organizational change. Recognizing these stages aids organizations in anticipating and managing employee reactions effectively. Each phase invo
0 views • 4 slides

Understanding the Normal Probability Curve
The Normal Probability Curve, also known as the normal distribution, is a fundamental concept in statistics. It is symmetric around the mean, with key characteristics such as equal numbers of cases above and below the mean, and the mean, median, and mode coinciding. The curve's height decreases grad
0 views • 10 slides

Understanding Strength-Duration Curve in Neuromuscular Stimulation
The strength-duration curve depicts the relationship between electrical stimulus intensity and time required for minimal muscle contraction. It helps assess nerve damage in lower motor neuron lesions. Various types of curves exist based on innervation status, such as normal innervation, complete den
0 views • 15 slides

Understanding Ethical Considerations in Manipulated Photography for Media
Ethical control in photojournalism involves capturing non-fiction events without manipulation, but some control over the image is acceptable within ethical bounds. However, moving into manipulated images for non-news events requires a different approach, involving subject and scene manipulation for
0 views • 28 slides
How Advanced Algorithms Are Reshaping Data Manipulation
Explore the transformative impact of advanced algorithms on data manipulation in our latest feature. This insightful exploration delves into the sophisticated technologies revolutionizing business analytics and understanding what is data manipulation
0 views • 7 slides

Basin Manipulation Simulation Analysis Tool Overview
Basin Manipulation Simulation Analysis Tool provides a comprehensive solution for managing and analyzing basin data, including tasks like basin manipulation, simulation analysis, case management, and defining simulation time steps. The tool allows for easy data entry, visualization of simulation res
2 views • 17 slides

Step-by-Step Guide to Purchasing a License in Learning Curve
Follow this detailed step-by-step guide to easily purchase a license in Learning Curve. Access the external portal link, add the license to your cart, enter your account information, proceed to checkout, provide payment details, and await approval confirmation via email.
0 views • 6 slides
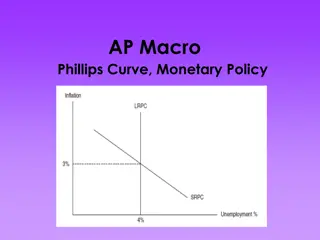
Understanding the Phillips Curve and Its Implications
The Phillips Curve, introduced by economist A.W. Phillips in 1958, initially showed an inverse relationship between unemployment rate (u%) and inflation rate (tt%). This led policymakers to consider a trade-off between reducing unemployment and increasing inflation. However, the concept faced challe
0 views • 22 slides

Exploring Curve Fitting and Regression Techniques in Neural Data Analysis
Delve into the world of curve fitting and regression analyses applied to neural data, including topics such as simple linear regression, polynomial regression, spline methods, and strategies for balancing fit and smoothness. Learn about variations in fitting models and the challenges of underfitting
0 views • 33 slides

Analysis of Lady Macbeth's Manipulation in Shakespeare's Macbeth
In a pivotal moment in Macbeth, Lady Macbeth's manipulation of her husband is showcased when she calls upon supernatural forces to overcome his kindness and convince him to kill Duncan. This extract is crucial in introducing Lady Macbeth's character and power dynamics within the play, particularly h
0 views • 49 slides

Understanding Global Wind Patterns and the Coriolis Effect
Air pressure differences cause winds, with the Coriolis Effect causing wind paths to curve as air moves from high to low pressure areas. In the Northern Hemisphere, winds curve to the right, and in the Southern Hemisphere, they curve to the left. Planetary and local winds are influenced by temperatu
0 views • 14 slides

Nonlinear Curve Fitting Techniques in Engineering
Utilizing nonlinear curve fitting techniques is crucial in engineering to analyze data relationships that are not linear. This involves transforming nonlinear equations into linear form for regression analysis, as demonstrated in examples and methods such as polynomial interpolation and exponential
0 views • 18 slides
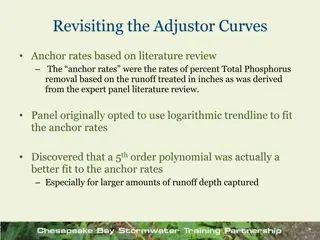
Revisiting Adjustor Curves for Total Phosphorus Removal Rates
Based on a literature review, it was found that a 5th-order polynomial curve is a better fit than the originally used logarithmic trendline for anchor rates of percent Total Phosphorus removal related to runoff depth. The expert panel report reflects the old curves while trendline equations in FAQ d
0 views • 7 slides
Practical Guide to Drawing Long-Term Yield Curve at Krugersdrift Dam
Learn how to draw a long-term yield curve at Krugersdrift Dam step-by-step, including setting up the study, browsing for data, importing hydrology files, manipulating the curve for accuracy, and achieving the final result.
0 views • 7 slides

Understanding Elasticity in Economics
Elasticity in economics refers to the responsiveness of demand to price changes. A more elastic curve results in larger quantity changes for small price changes, while a less elastic curve requires larger price changes to affect quantity consumed. The elasticity of demand can be measured by calculat
1 views • 13 slides
Storage and Manipulation of Liquefied Gases with Dewars and Cryostats
Storage and manipulation of liquefied gases involve using specialized equipment like Dewars and Cryostats to minimize heat transfer and maintain low temperatures. Dewars, invented by James Dewar, are double-walled vacuum vessels designed to store liquefied gases with minimal losses. The use of vacuu
0 views • 11 slides

Understanding Direct Manipulation in HCI
In this lecture, learn about the concept of direct manipulation in Human-Computer Interaction (HCI), including its benefits, drawbacks, and related terms such as engagement, distance, semantic, and articulatory distances. Explore the evolution of GUIs and interaction styles, and compare edge maps an
0 views • 24 slides

Understanding Narcissistic Abuse: The Insidious Manipulation of Victims
Narcissistic abuse is a form of severe psychological and emotional manipulation that targets a victim's spirit and identity. The abuser employs tactics such as lying, manipulation, denial of reality, and control. This abuse is often invisible and devastating, characterized by a lack of empathy and a
0 views • 15 slides

Visual Analysis: Decisions, Batman's Graphs, COVID Tests, and Flattening the Curve
Explore a collection of images featuring Mythbusters, Batman's original and corrected graphs, alternative Batman heights and weights, COVID tests graph, and a depiction of flattening the curve. Each image provides insight into decision-making, data representation, and visual storytelling. Learn how
0 views • 7 slides

Ethical Analysis of Manipulation in Organ Allocation System
This resource tackles the issue of manipulation in organ transplant waitlist priority through unnecessary medical interventions. It highlights the ethical concerns, potential harms, and ways to mitigate this manipulation, urging adherence to systemic safeguards and ethical clinical practice.
0 views • 9 slides

Innovative Multicellular Computing Circuits for Genetic Manipulation
Cells are utilized as computational devices in a innovative approach for genetic manipulation. Various logic gates and promoters are combined to achieve complex circuit behavior without the need for genetic manipulation. Advantages include a wide dynamic range and low variability, but with the drawb
0 views • 10 slides

Understanding Aggregate Supply and Demand in Economics
Explore the concept of aggregate supply and demand, including determinants and the relationship between price level and quantity demanded. Learn about the reasons for the downward slope of the aggregate demand curve and why the law of demand doesn't directly apply to the economy as a whole. Discover
0 views • 15 slides

Understanding Production Possibilities Curve and Economic Growth
Explore the concept of the production possibilities curve, including its assumptions, implications of being under or beyond the curve, types of opportunity costs, shifts in the curve, and the impact of economic growth on a nation's productivity and output capacity.
0 views • 18 slides

Understanding the Kinked Demand Curve Hypothesis in Oligopoly Markets
In oligopoly markets, prices often remain rigid despite cost changes. The kinked demand curve hypothesis, introduced by economist Sweezy, explains this phenomenon. It suggests that the demand curve an oligopolist faces has a kink at the current price level, with elastic demand above and inelastic de
0 views • 4 slides

Understanding the Learning Curve Phenomenon in Manufacturing
Performance improvement in manufacturing is described by the learning curve, where labor input per unit decreases as experience grows. The general equation and exponential curve of learning are discussed, along with the concept of learning rate. Determining the index of learning from the learning ra
0 views • 11 slides