Understanding Indifference Curve Analysis in Economics
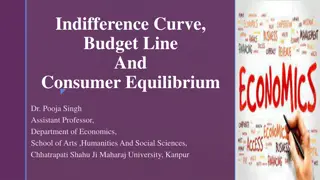
Indifference curve analysis in economics involves examining consumer preferences through the representation of various utility levels achieved from different combinations of goods. By combining indifference curves with budget constraints, optimal consumption bundles can be determined. The analysis includes maximizing utility, economic goods and bads, properties of indifference curves, and the concept of marginal rate of substitution.
- Indifference Curve Analysis
- Economics
- Utility Maximization
- Consumer Preferences
- Marginal Rate of Substitution
Download Presentation

Please find below an Image/Link to download the presentation.
The content on the website is provided AS IS for your information and personal use only. It may not be sold, licensed, or shared on other websites without obtaining consent from the author. Download presentation by click this link. If you encounter any issues during the download, it is possible that the publisher has removed the file from their server.
E N D
Presentation Transcript
16A Indifference Curve Analysis
A More Formal Analysis Utility maximization problem: max U(X, Y) subject to PXX+ PYY= M A consumer s preferences can be represented by indifference curves. The choices a consumer can make are represented by a budget constraint. Putting the two together allows us to examine a consumer s optimum consumption bundle.
Indifference Curves1 Indifference curves Represent the various combinations of two goods that yield the same level of utility. Maximization point A point at which a certain combination of two goods yields the most utility.
Economic Goods and Bads Suppose you have unlimited income. How much pizza and Pepsi would you buy? Economic goods Consuming more leads to higher total utility Marginal utility is positive Economics bads Consuming more leads to lower total utility Marginal utility is negative
Properties of Indifference Curves 1 Indifference curves are usually bowed inward. Quadrant I of previous figure Based on assumption that averages are preferred to extremes The slope of the indifference curve is the Marginal Rate of Substitution (MRS) The rate at which a consumer is willing to purchase one good instead of another
Properties of Indifference Curves 2 Indifference curves cannot be thick This would violate more is preferred to less
Indifference Curves Cannot Be Thick
Properties of Indifference Curves 3 Indifference curves cannot intersect This would violate the assumption of transitivity. If consumer preferences show A ~ B, and B ~ C, then A ~ C.
Indifference Curves Cannot Intersect
Perfect Substitutes1 Perfect substitutes Consumer is completely indifferent between two goods Will exhibit a constant MRS Gasoline: 1 gallon of Exxon gas is just as good as 1 gallon of Chevron gas. Milk: 2 pints of milk are just as good as a quart of milk.
Perfect Complements1 Perfect complements Consumer is interested in consuming two goods in fixed proportions. 1:1 ratio on left and right shoes 2:1 ratio on bike tires and bike frames 3:1 ratio for a gin and tonic Results in L-shaped indifference curves
The Budget Constraint1 Budget constraint Set of consumption bundles that represent the maximum amount the consumer can afford Depends on prices of goods and consumer income
Indifference Curve and Consumer Optimum 1 Utility maximization is actually a constrained optimization problem: Goal Optimize (maximize) utility; we want to make ourselves as happy as possible Constraint The budget constraint is based on our current income and the prices of the goods we wish to purchase
Indifference Curve and Consumer Optimum 2 Graphically, we can think like this: Goal Get on the highest indifference curve possible. Constraint I have to be on the budget constraint.
Income and Substitution Effects Substitution effect (SE) If good X becomes more expensive, we ll buy relatively less X and relatively more Y Real-income effect (IE) A change in price causes a change in real purchasing power. If the price of one good falls, we have less purchasing power, and we might choose to buy less of both goods.
Change in Price, Rotating Budget Constraint
Separating the SE and IE When the price of Pepsi increases: Purchasing power (real income) falls. All else being equal, the consumer will buy less Pepsi, and less pizza. But, now pizza is relatively cheaper than Pepsi. All else being equal, the consumer will buy less Pepsi, but more pizza.
Substitution and Income Effect, Graphically
Conclusion Indifference curves represent various combinations of two goods that yield the same level of utility. Indifference curves are inward sloping, they cannot be thick, and they cannot intersect. The point of maximum consumer satisfaction is found at the point of tangency between an indifference curve and the budget constraint. Framework allows economists to analyze the effect of price changes and budget constraints on the decisions that consumers make.


