What Is Business Intelligence and How It Turns Data into Dollars
Caption: Discover the transformative potential of Business Intelligence, from understanding its essence to harnessing Business Intelligence dashboard software for turning data into profitable decisions. Explore how this analytical tool revolutionizes data utilization for financial growth and learn w
4 views • 4 slides
Visibility or Blind Spot_ Enhancing Operational Efficiency with Business Intelligence Tools
Discover how Business Intelligence tools like Grow transform operational efficiency by turning data blind spots into actionable insights for sustained business growth. Explore real-world success stories and start your data-driven journey today with a Business Intelligence tool.
0 views • 5 slides
Does Your Business Intelligence Tool Know More About Your Business Than You Do_
Explore the untapped potential of Business Intelligence tools in our latest blog. Discover how to leverage data insights for strategic decisions and unlock the full potential of your business with the right Business Intelligence tool . Dive into practical tips for getting more from your BI tools tod
3 views • 7 slides
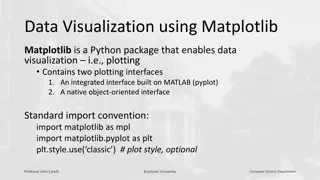
Data Visualization with Matplotlib in Python
Matplotlib is a powerful Python package for data visualization, offering both an integrated interface (pyplot) and a native object-oriented interface. This tool enables users to create various types of plots and gives control over the visualization process. Learn about basic operations, differences
7 views • 19 slides
DCU Power BI 101 Guide for End Users: Interactive Data Visualization Software
Learn about Power BI, an interactive data visualization software by Microsoft, focusing on business intelligence. The guide covers getting started, differences between Service and Desktop versions, and troubleshooting tips. Explore downloading reports, visuals, and summary data, enhancing your data
1 views • 13 slides
Theories of Intelligence: Monarchie vs. Spearman's Two-Factor Theory
The Monarchie Theory of Intelligence posits a single factor of intelligence, while Spearman's Two-Factor Theory divides intelligence into a general ability (G-factor) and specific abilities (S-factors). The implications of these theories on educational practices are discussed, shedding light on the
11 views • 25 slides
Open Source Chat Based Data Visualization With Helical Insight
Open Source Chat Based Data Visualization plays a pivotal role in modern business operations, enabling organizations to derive insights, make informed decisions, and drive growth. However, traditional visualization tools often come with high costs and steep learning curves, limiting accessibility an
1 views • 2 slides
Benefits of Open Source Chat-based Data Visualization
In the realm of Business Intelligence (BI), data visualization plays a pivotal role in transforming raw data into actionable insights. Traditional BI tools often require users to possess technical expertise in querying databases and creating visualizations. However, the emergence of open source chat
1 views • 2 slides
Data Wrangling like Ask On Data Provides Accurate and Reliable Business Intelligence
In current data world, businesses thrive on their ability to harness and interpret vast amounts of data. This data, however, often comes in raw, unstructured forms, riddled with inconsistencies and errors. To transform this chaotic data into meaningful insights, organizations need robust data wrangl
0 views • 2 slides
Open Source Alternative to Tableau for Data Visualization in 2024
As businesses increasingly rely on data-driven decisions, the demand for powerful data visualization tools continues to grow. Tableau has long been a leader in this space, known for its robust capabilities and user-friendly interface. However, open-source alternatives are gaining traction due to the
0 views • 2 slides
Old vs. New in Business Intelligence Data Visualization_ What Really Has Changed_
Discover how business intelligence data visualization has transformed from static reports to dynamic, interactive dashboards. Explore the technological advancements, such as AI, real-time data integration, and no-code tools, that have revolutionized how businesses harness and visualize their data.
0 views • 8 slides
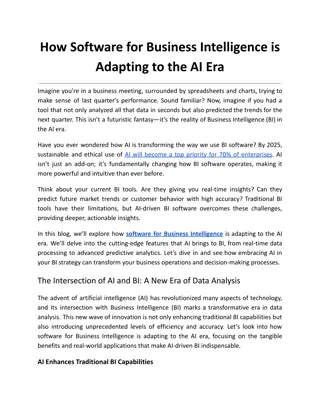
How Software for Business Intelligence is Adapting to the AI Era
Explore the revolutionary impact of AI on software for Business Intelligence in our latest blog. Discover how AI is enhancing BI tools such as Grow BI software with features like real-time data processing and predictive analytics, making data analysis more powerful and intuitive to make them the bes
1 views • 8 slides
Intelligence: Theories and Types Explored
Intelligence is the global capacity to comprehend the world, think logically, and utilize resources effectively. This content delves into the nature of intelligence, explaining intelligent behavior and discussing different types of intelligence such as verbal comprehension, spatial visualization, an
0 views • 13 slides
Intelligence: IQ and Emotional Intelligence in Education
The concept of intelligence is explored through IQ testing and emotional intelligence in education. IQ, based on cognitive abilities, helps in assessing academic potential and identifying learning barriers, while emotional intelligence (EQ) plays a crucial role in understanding and managing emotions
3 views • 13 slides
Reusing Phylogenetic Data for Enhanced Visualization and Analysis
Reusing phylogenetic data can revolutionize scientific research by enabling synthesis of knowledge and comparative analyses across scientific disciplines. However, a significant portion of valuable phylogenetic data is lost due to the prevalent use of static images for tree publication. To address t
0 views • 8 slides
Overview of Intelligence Testing in Psychology: Insights and Perspectives
Delve into the fascinating realm of intelligence testing as explored by Dr. Ranjan Kumar, covering the significance of IQ tests, the concept of intelligence, historical perspectives on intelligence measurement, and key figures like Alfred Binet and David Wechsler. Gain insights into the evolution of
3 views • 52 slides
Intelligence Reporting and Assessment in Policing
Intelligence plays a crucial role in police decision-making by providing evaluated information. This report outlines the National Intelligence Model, criteria for assessing intelligence relevance, accuracy, and value, as well as guidelines for information submission in law enforcement settings. It e
0 views • 8 slides
Bibitor LLC Inventory Analysis Case Study Phase 3
This case study by Bibitor LLC involves analyzing data related to the liquor store chain's wine and spirits business. Students will gain insight into data analytics, visualization, and statistical analysis to make informed business decisions. The case is presented in phases, focusing on data prepara
1 views • 21 slides
Artificial Intelligence and Intelligence in Computers
Artificial Intelligence (AI) aims to create intelligent computer systems that mimic human behaviors. It involves algorithms derived from human intelligence to make computers smarter and more useful. This includes the ability to acquire knowledge, think, reason, and exhibit goal-oriented behavior. Th
1 views • 13 slides
Interactive Plotting with ggplot and Shiny: Enhancing Galaxy Visualization Tools
Explore the concept of transforming existing ggplot2 Galaxy tools into interactive platforms using Shiny or Plotly implementations. Discover a variety of plot types available with ggplot2, such as barplots, violin plots, PCA plots, and heatmaps. Utilize additional plot options through various geom_*
3 views • 9 slides
Insights into Theories and Definitions of Intelligence
Various psychologists throughout history have defined intelligence in different ways, highlighting aspects such as judgment, reasoning, adaptation, problem-solving, and overall mental capacity. From Binet to Gardner, each perspective sheds light on the diverse facets of intelligence, emphasizing the
3 views • 52 slides
Design and Evaluation in Visualization Techniques
Understanding the importance of formal evaluations in visualization techniques, this material covers a range of evaluation methods including empirical and analytic approaches such as usability tests, controlled experiments, and expert reviews. It delves into the scientific method of hypothesis forma
1 views • 41 slides
Multidimensional Icons in Data Visualization Solutions
This collection showcases various types of visual icons used in data visualization to represent values of different variables, such as categorical, quantitative, and Boolean data. Each icon summarizes specific information for a given item in a collection, ranging from nominal and ordinal data to the
0 views • 9 slides
Unpacking the Notions of Intelligence and Social Hegemony
This presentation delves into the complex concepts of intelligence and social hegemony, exploring historical perspectives, scholarly debates, and folk beliefs. It challenges the hegemonic nature of contemporary intelligence definitions and examines the power dynamics within civil society. Through a
1 views • 14 slides
Enhancing Safety in Navigation Through Improved Data Quality Visualization
The IHO Data Quality Working Group focuses on classifying and depicting the quality of digital hydrographic information to ensure safe navigation. The group addresses the need for clear warnings on ECDIS displays regarding poor-quality survey data. Despite progress in developing visualization method
1 views • 34 slides
Software Design Patterns for Information Visualization
Explore design patterns for information visualization interfaces, understand the complexities, and leverage tools like Google API. Learn about different software design patterns, categories of patterns for information visualization, and the relationships between them. Discover the reference model fo
0 views • 27 slides
Business Intelligence for Effective Business Analysis
Business Intelligence (BI) involves utilizing techniques and tools to convert raw data into valuable insights for strategic decision-making. By analyzing unstructured data, BI helps identify new opportunities and enhance business strategies for competitive advantage and long-term success. Components
0 views • 7 slides
Interactive Data Visualization Tools and Techniques Quiz
This quiz tests knowledge on data visualization tools, techniques, and concepts. Questions cover topics such as the use of EDA in data visualization, interactive graph outputs, historical figures in data visualization, GIS data types in SAS/JMP, outlier detection in 3D scatterplots, and limitations
1 views • 11 slides
NAFN Data and Intelligence Services Overview
NAFN Data and Intelligence Services, established in 1996, is a comprehensive hub for data and intelligence solutions, serving around 90% of local authorities. Operating as a not-for-profit organization funded by membership and grants, NAFN offers various services such as credit reporting, authorised
0 views • 16 slides
Python Review for Data Analytics Tutorial
This Python review tutorial for data analytics covers essential programming concepts, data manipulation, and visualization using Python. Presented by Benjamin Ampel and Steven Ullman from the Artificial Intelligence Lab at the University of Arizona. The tutorial aims to enhance understanding of lang
0 views • 42 slides
Enhancing Classmate's Data Visualization for Homework Assignment 2
Explore the process of applying a classmate's data visualization code to your own data for Homework Assignment 2. Critique the effectiveness of the visualization in conveying the intended point and offer suggestions for improvement if necessary. Follow the steps outlined to submit your completed ass
0 views • 4 slides
A Comprehensive Guide to Tableau Data Visualization
Tableau is a user-friendly business intelligence software that enables users to connect to various data sources and create interactive dashboards easily. Tableau Desktop offers powerful visualization tools and supports connections to different data systems. The software provides a range of graphic t
0 views • 15 slides
Organizational Intelligence Technologies
Organizational intelligence technologies involve three kinds of intelligence - understanding independently, appreciating what others can understand, and understanding neither for itself nor through others. This concept emphasizes the importance of collecting, storing, processing, and interpreting da
0 views • 47 slides
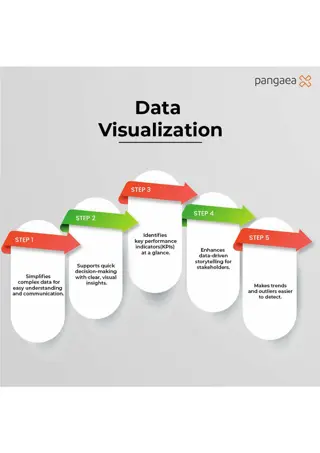
Maximize Business Impact with Data Visualization
This infographic shows how data visualization simplifies complex data, supports decision-making, highlights KPIs, and enhances data-driven storytelling. Its an essential tool for identifying trends and outliers. Discover expert data visualization talent at Pangaea X by visiting www.pangaeax.com.
7 views • 1 slides
Data Visualization Presentations Collection
Collection of various image slides containing charts, graphs, and data visualization elements. The slides showcase different types of visual representations such as bar graphs, line charts, percentages, and more. Each slide provides a unique visualization, making it a diverse collection for presenta
0 views • 13 slides
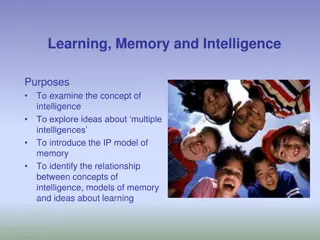
Concepts of Intelligence, Memory, and Learning
This presentation delves into the concept of intelligence, explores multiple intelligences, introduces the IP model of memory, and examines the relationship between intelligence concepts, memory models, and learning ideas. It discusses various understandings of intelligence, challenges the fixed int
1 views • 20 slides
Successful Intelligence in Leadership by Prof. J. Malan
Successful intelligence in leadership involves a balance of analytical, practical, and creative abilities. Fiedler and Link suggest that intelligence predicts leadership success under low-stress conditions, highlighting the interaction between stress, intelligence, and leadership. Leaders must analy
1 views • 33 slides
Enhancing Data Visualization Community Engagement through Viz and Tell Sessions
This resource outlines a model for building a critical community focused on data visualization, offering Viz and Tell/Coffee Break sessions to encourage engagement and learning. Topics covered include visualization instruction, tools, ethics, data journalism, and more. The model emphasizes open disc
0 views • 6 slides
Importance of Data Visualization in Network Management
Data visualization plays a crucial role in understanding and extracting value from data, especially in the realm of network management. Visualization techniques enable better decision-making, pattern recognition, and storytelling with data. By exploring data through visualization tools, one can unco
0 views • 26 slides
Top 5 Open Source Data Visualization Tools
This blog explores the top 5 open source data visualization tools that are transforming the way we interpret data. Whether you're a data analyst, developer, or business professional, these tools can help you unlock the power of data visualization.
0 views • 5 slides


