PV-Trend: A JSL Application for Pharmacovigilance Trending Topics
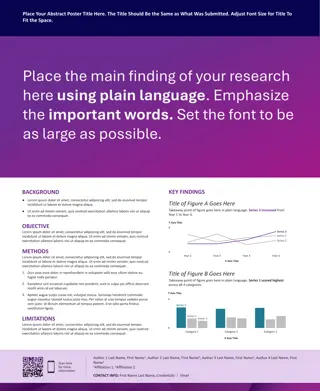
Application PV-Trend is designed for monitoring the safety of medicinal products, providing a user-friendly interface for defining topics, intervals, and exposures. It allows medical reviewers to create trending datasets and graphs, with statistical interpretations and significant time savings. The tool is essential for proactive monitoring critical for patient safety and regulatory compliance.

Download Presentation

Please find below an Image/Link to download the presentation.
The content on the website is provided AS IS for your information and personal use only. It may not be sold, licensed, or shared on other websites without obtaining consent from the author. Download presentation by click this link. If you encounter any issues during the download, it is possible that the publisher has removed the file from their server.
E N D
Presentation Transcript
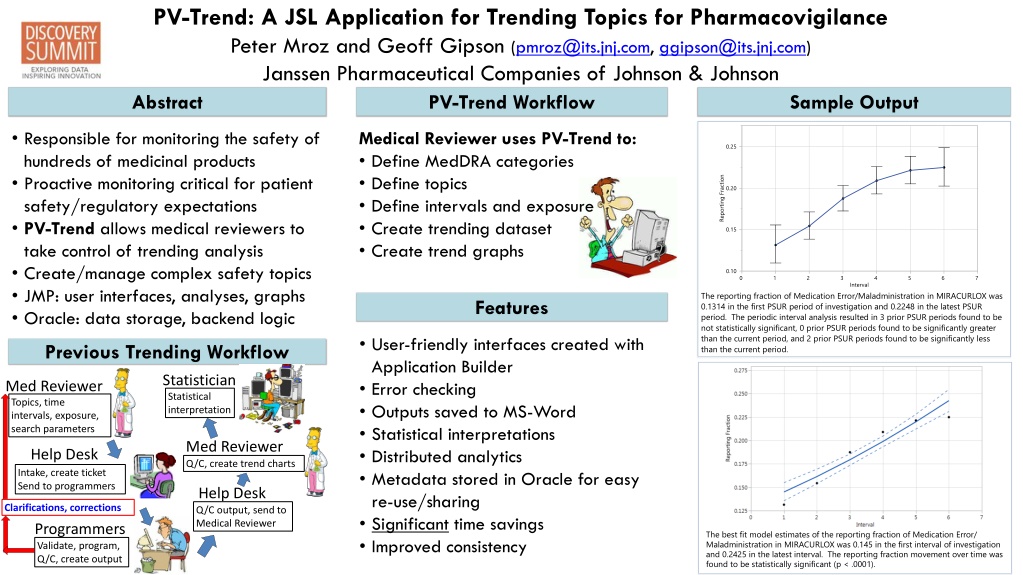
PV-Trend: A JSL Application for Trending Topics for Pharmacovigilance Peter Mroz and Geoff Gipson (pmroz@its.jnj.com, ggipson@its.jnj.com) Janssen Pharmaceutical Companies of Johnson & Johnson Abstract PV-Trend Workflow Sample Output Responsible for monitoring the safety of hundreds of medicinal products Proactive monitoring critical for patient safety/regulatory expectations PV-Trend allows medical reviewers to take control of trending analysis Create/manage complex safety topics JMP: user interfaces, analyses, graphs Oracle: data storage, backend logic Medical Reviewer uses PV-Trend to: Define MedDRA categories Define topics Define intervals and exposure Create trending dataset Create trend graphs The reporting fraction of Medication Error/Maladministration in MIRACURLOX was 0.1314 in the first PSUR period of investigation and 0.2248 in the latest PSUR period. The periodic interval analysis resulted in 3 prior PSUR periods found to be not statistically significant, 0 prior PSUR periods found to be significantly greater than the current period, and 2 prior PSUR periods found to be significantly less than the current period. Features User-friendly interfaces created with Application Builder Error checking Outputs saved to MS-Word Statistical interpretations Distributed analytics Metadata stored in Oracle for easy re-use/sharing Significant time savings Improved consistency Previous Trending Workflow Statistician Med Reviewer Statistical interpretation Topics, time intervals, exposure, search parameters Med Reviewer Help Desk Q/C, create trend charts Intake, create ticket Send to programmers Help Desk Clarifications, corrections Q/C output, send to Medical Reviewer Programmers The best fit model estimates of the reporting fraction of Medication Error/ Maladministration in MIRACURLOX was 0.145 in the first interval of investigation and 0.2425 in the latest interval. The reporting fraction movement over time was found to be statistically significant (p < .0001). Validate, program, Q/C, create output
PV-Trend: A JSL Application for Trending Topics for Pharmacovigilance Peter Mroz and Geoff Gipson (pmroz@its.jnj.com, ggipson@its.jnj.com) Janssen Pharmaceutical Companies of Johnson & Johnson Custom MedDRA Categories Topic Definition Interval, Exposure Definition Refine custom MedDRA categories Where to search (events, medical history, indications) Additional fatal criteria Age and age group, region, country Set of terms defined by MedDRA level (SOC, HLGT, HLT, PT, SMQ) Error checking Stored in Oracle Define intervals and date ranges Enter exposure for each interval Exposure Divisor: Per 100, Per 1,000, Per 10,000 etc. Units: Patients, Capsules, etc. Sample error checking output Sample topic for Children
PV-Trend: A JSL Application for Trending Topics for Pharmacovigilance Peter Mroz and Geoff Gipson (pmroz@its.jnj.com, ggipson@its.jnj.com) Janssen Pharmaceutical Companies of Johnson & Johnson Create Trending Dataset Users Specify Drug(s) of interest One or more data sources: Aggregate report(s) (snapshot of cases) Caselist(s) (snapshot of cases) Spreadsheet General database query Additional selection criteria Date range Valid Medically Confirmed Associated to drug Interval Definition Topic Set
PV-Trend: A JSL Application for Trending Topics for Pharmacovigilance Peter Mroz and Geoff Gipson (pmroz@its.jnj.com, ggipson@its.jnj.com) Janssen Pharmaceutical Companies of Johnson & Johnson Trending Dataset All search parameters are table variables Topics are represented by separate columns with 0 meaning no match and 1 meaning match
PV-Trend: A JSL Application for Trending Topics for Pharmacovigilance Peter Mroz and Geoff Gipson (pmroz@its.jnj.com, ggipson@its.jnj.com) Janssen Pharmaceutical Companies of Johnson & Johnson Trending Analysis Separate output for each topic Click on a topic to see output displayed in the various tabs Tabs for: Tabulations Reporting Fraction (graphs) Reporting Rate (graphs) Topic Details General Search Parameters Methods Save to MSWord button copies all output for a topic to a Word document
PV-Trend: A JSL Application for Trending Topics for Pharmacovigilance Peter Mroz and Geoff Gipson (pmroz@its.jnj.com, ggipson@its.jnj.com) Janssen Pharmaceutical Companies of Johnson & Johnson Trending Analysis graphs Periodic Interval Analysis: Compare current (latest) period with all other periods Current-Cumulative Comparison: compare current (latest) period with cumulative value of all previous periods Regression: for general trend Reporting Fraction (RF) and Report Rate (RR) shown on separate tabs
PV-Trend: A JSL Application for Trending Topics for Pharmacovigilance Peter Mroz and Geoff Gipson (pmroz@its.jnj.com, ggipson@its.jnj.com) Janssen Pharmaceutical Companies of Johnson & Johnson Topic Details General Search Parameters Shows what was searched (Events, Indications, Medical History) Shows the set of MedDRA terms used for this topic Shows search parameters that apply to all topics Drugs Date Range Data Sources Valid (Y/N) Medically Confirmed (Y/N) Associated to drug (Y/N) Overall Search Parameters Parameter Drugs Start Date End Date PSUR Period Definition PSUR Topics Aggregate Report Descriptions Import Cases from Database Query Yes Valid Med Confirmed Associated Value MIRACURLOX 01-Jul-2010 31-Dec-2015 MIRACURLOX PBRER (01-Jan-2015 to 31-Dec-2015) MIRACURLOX 5-Year Search Final, MIRACURLOX PBRER/PSUR Dataset 01Jan15-31Dec15 Valid Medically Confirmed Associated
PV-Trend: A JSL Application for Trending Topics for Pharmacovigilance Peter Mroz and Geoff Gipson (pmroz@its.jnj.com, ggipson@its.jnj.com) Janssen Pharmaceutical Companies of Johnson & Johnson Methods Reporting Fraction RF Periodic Interval Analysis A periodic interval analysis was performed on reporting fractions for the most recent 6 intervals. A periodic interval analysis compares the confidence interval from the most recent interval with the confidence intervals from each preceding interval. The confidence interval for each reporting fraction is calculated using the Clopper-Pearson method. The confidence intervals are adjusted for multiple testing using the Bonferroni correction using an = 0.05. Since there are 5 comparisons of interest in this analysis (current period vs. each prior period), the confidence intervals are calculated using the lower 0.5% bound and upper 99.5% bound of the Beta distribution. RF Cumulative Prior Interval Analysis A cumulative prior interval analysis was performed on reporting fractions for the most recent 6 intervals. A cumulative prior interval analysis compares the confidence interval from the most recent interval with the confidence interval for the aggregated data from the preceding intervals. The confidence interval for each reporting fraction is calculated using the Clopper-Pearson method using an = 0.05. The confidence intervals are calculated using the lower and upper 95% bounds of the Beta distribution. RF Regression Analysis A regression analysis was performed on reporting fractions for the most recent 6 intervals. The regression analysis evaluates whether there is a trend in the reporting fractions over time. For the reporting fraction regression a Generalized Linear Model [family = Binomial, link = logit] model was utilized. Reporting Rate RR Periodic Interval Analysis A periodic interval analysis was performed on reporting rates for the most recent 6 intervals. A periodic interval analysis compares the confidence interval from the most recent interval with the confidence intervals from each preceding interval. The confidence interval for each reporting rate is calculated using the Exact Gamma method. The confidence intervals are adjusted for multiple testing using the Bonferroni correction using an = 0.05. Since there are 5 comparisons of interest in this analysis (current period vs. each prior period), the confidence intervals are calculated using the lower 0.5% bound and upper 99.5% bound of the Gamma distribution. RR Cumulative Prior Interval Analysis A cumulative prior interval analysis was performed on reporting rates for the most recent 6 intervals. A cumulative prior interval analysis compares the confidence interval from the most recent interval with the confidence interval for the aggregated data from the preceding intervals. The confidence interval for each reporting rate is calculated using the Exact Gamma method using an = 0.05. The confidence intervals are calculated using the lower and upper 95% bounds of the Gamma distribution. RR Regression Analysis A regression analysis was performed on reporting rates for the most recent 6 intervals. The regression analysis evaluates whether there is a trend in the reporting rates over time. For the reporting rate regression, a Generalized Linear Model [family = Poisson, link = log, offset = log(Exposure)] model was utilized.
PV-Trend: A JSL Application for Trending Topics for Pharmacovigilance Peter Mroz and Geoff Gipson (pmroz@its.jnj.com, ggipson@its.jnj.com) Janssen Pharmaceutical Companies of Johnson & Johnson Trending Analysis graphs Interval Analysis: Statistically significant when upper and lower confidence bounds are non-overlapping Regression: Statistically significant when a horizontal trend line CANNOT be fit inside confidence bounds Regression Plot 0.07 Statistically significant Reporting Fraction 0.06 0.05 Not statistically significant 0.04 0.03 0 1 2 3 4 5 6 7 Interval Not statistically significant
PV-Trend: A JSL Application for Trending Topics for Pharmacovigilance Peter Mroz and Geoff Gipson (pmroz@its.jnj.com, ggipson@its.jnj.com) Janssen Pharmaceutical Companies of Johnson & Johnson Trending Analysis Calculations c. Calculate the reporting fraction upper confidence limit using a beta distribution JSL function: 1. Calculate the total number of cases per interval beta quantile(ucl_alpha, (topic_cases[i] + 1), (:Total_Cases[i] - topic_cases[i])) 2. For each topic, calculate the number of cases per topic per interval 3. Create a cumulative table with two rows. a. Row 1 is for the intervals 1 to (n-1) b. Row 2 is for the nth interval d. Calculate the reporting rate topic_cases[i] * Exposure_Divisor / Exposure[i] 4. Calculate the Bonferroni Correction. Start with 95% and divide by the greater of (nperiods 1) or 1. e. Calculate the reporting rate lower confidence limit using a gamma distribution JSL function: Exposure_Divisor * gamma quantile(lcl_alpha, topic_cases[i], 1 / Exposure[i]) bonferroni_factor = max(nperiods - 1, 1); lcl_alpha = .025 / bonferroni_factor; ucl_alpha = 1 - lcl_alpha; f. Calculate the reporting rate upper confidence limit using a gamma distribution JSL function: 5. Loop over each topic: Exposure_Divisor * gamma quantile(ucl_alpha, (topic_cases[i] + 1), 1 / Exposure[i]) a. Calculate the reporting fraction (# topic cases per period / total cases per period) g. Calculate the values for a f for the cumulative comparison b. Calculate the reporting fractionlower confidence limit using a beta distribution JSL function: beta quantile(lcl_alpha, Topic_cases[i], (Total_Cases[i] - Topic_cases[i] + 1));
PV-Trend: A JSL Application for Trending Topics for Pharmacovigilance Peter Mroz and Geoff Gipson (pmroz@its.jnj.com, ggipson@its.jnj.com) Janssen Pharmaceutical Companies of Johnson & Johnson Trending Analysis Regression Calculations h. Calculate a regression line for reporting fraction by interval using JMP s Fit Model platform. Parameters are: k. Calculate a regression line for reporting rate by interval using JMP s Fit Model platform. Parameters are: i. Y values: ii. Effects: iii. Personality: iv. GLM Distribution: Binomial v. Link Function: Topic Cases, Total Cases Interval Generalized Linear Model i. Offset: ii. Y value: iii. Effects: iv. Personality: v. GLM Distribution: vi. Link Function: Log(Exposure) Topic Cases Interval Generalized Linear Model Poisson Log Logit i. Save predicted values and mean confidence intervals from the reporting fraction regression to the dataset. This will add the following columns to the dataset: l. Save predicted values and mean confidence intervals from the reporting rate regression to the dataset. This will add the following columns to the dataset: i. Pred <topic> ii. Lower 95% Mean <topic> iii. Upper 95% Mean <topic> i. Pred <topic> 2 ii. Lower 95% Mean <topic> 2 iii. Upper 95% Mean <topic> 2 j. Convert the predicted values and mean confidence intervals to a reporting fraction by dividing by the total number of cases per period. m. Convert the predicted values and mean confidence intervals to a reporting rate: Pred <topic> 2[i] * (:Exposure Divisor / :Exposure) Lower 95% Mean <topic> 2[i] * (:Exposure Divisor / :Exposure) Upper 95% Mean <topic> 2[i] * (:Exposure Divisor / :Exposure)
PV-Trend: A JSL Application for Trending Topics for Pharmacovigilance Peter Mroz and Geoff Gipson (pmroz@its.jnj.com, ggipson@its.jnj.com) Janssen Pharmaceutical Companies of Johnson & Johnson Summary/Conclusions Innovative tool Distributed analytics Metadata stored in Oracle for easy re-use/sharing Time savings Improved consistency Improved analysis leads to improved patient safety JMP crucial to the success of this system: User interface design Graphs Analysis (tabulations, confidence intervals, regression) Oracle access