Enhancing Precipitation Interpolation Methods for High-Resolution Data Analysis
Accurate interpolation of precipitation data is crucial for various applications, especially in regions with limited data coverage like Greece. This study focuses on improving the creation of a precipitation atlas for Greece using daily observation analysis. By analyzing the reliability of the methodology based on convective cases, the goal is to provide high-resolution datasets for verification purposes. Various interpolation methods like MISH are discussed, emphasizing the importance of utilizing climate statistical properties to generate realistic precipitation fields. Spatial analysis considers geophysical parameters to enhance the accuracy of interpolated data.
- Precipitation
- Interpolation Methods
- High-Resolution Data
- Climate Statistical Properties
- Geophysical Parameters
Download Presentation

Please find below an Image/Link to download the presentation.
The content on the website is provided AS IS for your information and personal use only. It may not be sold, licensed, or shared on other websites without obtaining consent from the author. Download presentation by click this link. If you encounter any issues during the download, it is possible that the publisher has removed the file from their server.
E N D
Presentation Transcript
Using climate statistical properties to generate realistic interpolated precipitation fields Flora Gofa . . . 20TH COSMO General Meeting , 3-6 Sept 2018, St. Petersburg, WG5 Session
... Motivation Accurate knowledge f precipitation patterns in terms of quantity and spatial structure is required for many applications, including verification purposes that require very high resolution datasets Lack of available precipitation data, not only in time intervals that enable the evolution of a weather event to be well represented, but mainly with adequate spatial coverage. For rain gauges, data are continuous in time, but the density of networks is insufficient. Particularly acute in mountainous regions like Greece, where physical access is limited, and further exacerbated by the strong influence of topography Precipitation estimates based on radar and satellite gridded data have a high degree of uncertainty associated with them and therefore should only be used in combination with surface measurements. Goals Extend the method of the creation of precipitation atlas for Greece in the creation of daily precipitation observation analysis to be used for verification purposes that require very high resolution datasets Analyze the reliability of the methodology based on a certain convective case
... Interpolation Methods Deterministic Probabilistic Other Use only geometric characteristics of point observations Nearest neighborhood Fixed Radius Inverse distance weighting (IDW) Developed only for meteorological purposes (using deterministic and probabilistic approach) AURELHY (1987) PRISM (1994) MISH (2007) Based on probabilistic theory and use the concept of randomness Kriging methods 20TH COSMO General Meeting , 3-6 Sept 2018, St. Petersburg, WG5 Session
MISH . . . (Meteorological Interpolation based on Surface Homogenized Data) (Szentimrey & Bihari, 2014) The main advantages of MISH method: requires homogenized data series gets information from a long term data series (often geostatistical methods use a single realization in time for modeling but meteorological data are spatio-temporal!) calculates the optimum interpolation parameters which are certain known functions of the climate statistical parameters interpolation formula depends on climate elements 20TH COSMO General Meeting , 3-6 Sept 2018, St. Petersburg, WG5 Session
... Spatial analysis approach The data series of mean monthly values are correlated with geophysical parameters (elevation height, slope, orientation, % sea- land, distance from coast line, etc.) that correspond to the latititude-longitude position of each station Shuttle Radar Topography Mission The analysis procedure is performed in two stages: : Calculation of geophysical parameters from the digital surface model DEM originating from NASA (http://srtm.csi.cgiar.org) : Application of a multiple linear regression analysis to correlate the mean monthly values to the geophysical parameters. 20TH COSMO General Meeting , 3-6 Sept 2018, St. Petersburg, WG5 Session
... Additional Geophysical Parameters Besides first 14 AURELHY principal components proposed by the AURELHY interpolation method (Analyse Utilisant le Relief pour les besoins del Hydrom t orologie) the following predictors were used: Elevation (m) Euclidian distance to coastline (Km) Land to sea percentage coverage (%) within a 10 km radius Latitude (decimal degrees) Solar irradiance on the Earth surface (W.m-2) (calculated via libRadtran (Mayer and Kylling, 2005)) 20TH COSMO General Meeting , 3-6 Sept 2018, St. Petersburg, WG5 Session
... Spatial Analysis MISH (Model) Input 1. Data series of mean monthly precipitation values for 157 stations (for precipitation Geophysical parameters in gridded format 2. Output 1. Geophysical parameters that have high correlation with the precipitation values for each month Correlation coefficients Degree of correlation 2. 3. 20TH COSMO General Meeting , 3-6 Sept 2018, St. Petersburg, WG5 Session
... Spatial Interpolation MISH (Interpol) (used to interpolate any observational field) Input 1. 2. 3. 4. Correlation with main geophysical parameters relevant to climate data Spatial analysis of precipitation tendencies Point observations to be interpolated Background gridded field (e.g. derived from remote sensing) Output 1. Interpolated precipitation values in a grid of resolution 30 (750mx750m) 20TH COSMO General Meeting , 3-6 Sept 2018, St. Petersburg, WG5 Session
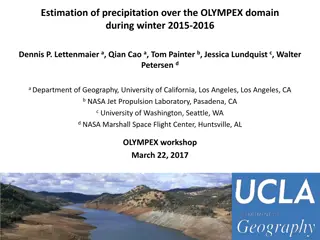
... Test case: 16-17 July 2017 A mesoscale convective system that affected Greece during the period 16-17/07/2017. Cut off low system passed over the country followed by a cold front combined with strong convective activity. g Observations from 200 surface stations were available as 24h accumulations The point observations was attempted to be interpolated spatially using MISH method on a ~1km grid. The interpolation is based on the correlations with the geophysical parameters that resulted from the spatial analysis of the climatological data for February (model part of MISH simulation)
... Steps that were followed The first step in the use of the precipitation correlation coefficients produced by the modelling procedure with the MISH software for month of July. Although the modeling system is based on monthly data, daily or even smaller time interval means can also be interpolated with the correlations resulting from the modeling procedure for the month the event took place. It is important to note that the correlation coefficient (R) for the precipitation for the month of July with the geophysical parameters was 0.781 Interpolation using MISH of the point observations with and without background filed (H-SAF) 20TH COSMO General Meeting , 3-6 Sept 2018, St. Petersburg, WG5 Session
... Test case: 16-17 July 2017 Location and precipitation amount of observations Left: 16.07.17, Right:17.07.17 Interpolated values from H-SAF product H05. 20TH COSMO General Meeting , 3-6 Sept 2018, St. Petersburg, WG5 Session
... Interpolated values from 24h precipitation values Left: surface stations and background field Right: only surface stations 16.07.17 Remarks Use of background field does not alter the structure of precipitation Amount of precipitation is increased in areas where no surface station was present. the weight that the software Is given to the background info is less compared to that of the observations 17.07.17 20TH COSMO General Meeting , 3-6 Sept 2018, St. Petersburg, WG5 Session
... Method evaluation approach To obtain insight into the error associated with the application, a statistical evaluation procedure was performed. Code was developed that allowed the application of the Leave-One-Out Cross Validation (LOOCV) technique where the interpolation software is trained N separate times on all data except for one point (one surface station) and a prediction is made for that point. LOOCV is essentially an estimate of the generalized performance of model trained on n-1 samples of data. 20TH COSMO General Meeting , 3-6 Sept 2018, St. Petersburg, WG5 Session
... Mean statistical indices derived from the application of LOOCV RMSE 16.81996 16.73763 17.38186 14.72006 ME MAE 8.782383 7.840984 10.23731 10.57554 16.07.17 NOBKG 16.07.17 W/BKG 17.07.17 NOBKG 17.07.17 W/BKG -2.33917 -2.44098 -2.32477 -2.47741 MISH interpolation approach has a tendency to underestimate precipitation amounts in all cases (negative ME), while the use of background information slightly improved the predicted precipitation values, mainly for 17.07.17, while the RMSE was on the order of 14.7-17.4mm/24h. 20TH COSMO General Meeting , 3-6 Sept 2018, St. Petersburg, WG5 Session
... Next steps Apply the MISH interpolation method on different precipitation regimes, not only on convective events If method is proved to work satisfactory for this purpose, will be also applied on forecast data, in order to have a more realistic interpolation of data (not purely mathematical thansformation as it is usually the case) on finer resolution grids Connect the use of MISH for high resolution obs and fct datasets for spatial verification applications 20TH COSMO General Meeting , 3-6 Sept 2018, St. Petersburg, WG5 Session
... ? 20TH COSMO General Meeting , 3-6 Sept 2018, St. Petersburg, WG5 Session
Additional slides . . . WG5 parallel session, COSMO General Meeting, Jerusalem 2017
... Impact of homogenization procedure corrections Example of Mean Temperature data series correction : 1978 : 1982 WG5 parallel session, COSMO General Meeting, Jerusalem 2017
... Methodology Elevation data come from the DEM originating from NASA (SRTM) 90 x 90m (http://srtm.csi.cgiar.org) Interpolation method: Interpolation based on Surface Homogenized Data), developed for meteorological purposes (Szentimrey & Bihari, 2014) First 15 principal components proposed by the AURELHY interpolation method (Analyse Utilisant le Relief pour les besoins del Hydrom t orologie) were used as geophysical variables MISH (Meteorological WG5 parallel session, COSMO General Meeting, Jerusalem 2017
... Using the methodology followed for the production of a climate atlas . . Homogenization of climate data . Spatial analysis of data series C. Spatial Interpolation D. Mapping 20TH COSMO General Meeting , 3-6 Sept 2018, St. Petersburg, WG5 Session
... Location of Stations and Data Climatological data for precipitation from 157 surface stations for the period 1970 -2004 (35 years) Homogenization method HOMER (COST ES0601) 20TH COSMO General Meeting , 3-6 Sept 2018, St. Petersburg, WG5 Session
January- mean precipitation WG5 parallel session, COSMO General Meeting, Jerusalem 2017
... Monthly correlation coefficient for various parameters 1 0.9 0.8 0.7 0.6 max temp sunshine preci 0.5 0.4 0.3 0.2 0.1 0 1 2 3 4 5 6 7 8 9 10 11 12 20TH COSMO General Meeting , 3-6 Sept 2018, St. Petersburg, WG5 Session
. : 1. 2. 3. 4. 5. 6. 7. 8. 800 800 800 800 800 800 10 . 10 . 10 . 10 . 9. 10. 11. 12. 13. 14. 20TH COSMO General Meeting , 3-6 Sept 2018, St. Petersburg, WG5 Session
