Understanding Stars: The Hertzsprung-Russell Diagram and Stellar Properties

The Hertzsprung-Russell Diagram is a tool that plots the luminosity or absolute magnitude of stars against their surface temperatures, revealing distinct groups that represent stages in the stars' life cycles. Apparent magnitude measures how bright a star appears from Earth, while absolute magnitude reflects a star's brightness at a standard distance. By examining mass, size, temperature, and color, astronomers can gain insights into the diverse properties of stars.

Download Presentation

Please find below an Image/Link to download the presentation.
The content on the website is provided AS IS for your information and personal use only. It may not be sold, licensed, or shared on other websites without obtaining consent from the author. Download presentation by click this link. If you encounter any issues during the download, it is possible that the publisher has removed the file from their server.
E N D
Presentation Transcript
The Hertzsprung-Russell Diagram The H-R diagram plots the luminosity (brightness) or absolute magnitude of stars against their surface temperatures. Most stars fall into distinct groups in the H-R diagram, because the groups represent stages in thelife cycles of the stars.
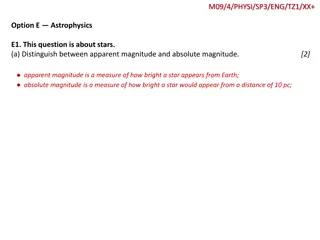
Apparent Magnitude The apparent magnitude of a star is a measure of how bright a star appears to be to an observer on Earth. The lower the apparent magnitude number, the brighter the star is. Some of the brightest stars in the sky are classified as first-magnitude stars. The faintest stars that can be seen with our unaided eye are called sixth-magnitude stars. Some stars are so bright that they have a negative apparent magnitude.
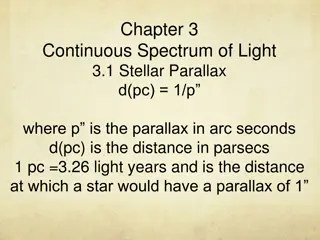
Luminosity and Absolute Magnitude Absolute magnitude is a measure of how bright a star would be if all stars were at the same distance (ten parsecs) from Earth. Thus, distance from Earth no longer becomes a factor in how bright a star is. Remember, very bright stars that are very far from Earth may appear to be very faint to us. For example: Since our sun is so close to Earth, it has an apparent magnitude of 26.7. However, the sun has an absolute magnitude of only +4.8. Remember, the mass and the temperature of the star are important!
Absolute and apparent magnitude Apparent magnitude is how bright a star appears to be from earth due to how close or far away it is. Absolute magnitude is how much light is actually given off by a star.
Mass, Size, and Temperature of Stars Stars vary greatly in their masses, size, and densities. We cannot observe a star s mass directly. We can only calculate it based on other observations. The larger the mass, the stronger the gravitational effect on the bodies around it. Stellar masses are expressed as multiples of the mass of our sun, which is called one solar mass.
Temperature and Color of Stars Stars also vary in temperature. The range of colors a star emits depends on its surface temperature. Analyzing the light emitted by a star helps us to determine the stars temperature. Cooler surface temperatures (below 3900 C) results in a red coloring (for example, Betelgeuse). Hotter temperatures change the color to orange, then yellow (our sun, at about 5500 C), and then white. The hottest stars (such as Sirius) have a bluish white color (above 9500 C).
Two astronomers discovered a relationship between the absolute magnitude (real brightness) of a star and its surface temperature. They plotted the data on a graph. Ejnar Hertzsprung Denmark Henry Russell USA
The Hertzsprung-Russell Diagram About 90% of all stars seem to fit in a band that runs from the upper left of the diagram to the lower right. This band is called the main sequence. The stars in this band are called main- sequence stars. Main-sequence stars vary in surface temperature and absolute magnitudes. However, all main-sequence stars are actively fusing hydrogen into helium.
The Hertzsprung-Russell Diagram Above the main-sequence stars are giant stars. Giant stars are more luminous and have diameters from 10-100 times greater than our sun. Super giants are giant stars that have diameters more than 100 times greater than our sun. These giant stars (but relatively cool) are very luminous.
The Hertzsprung-Russell Diagram Also included on the H-R diagram are white dwarfs. These are stars that are near the end of their lives. These were once red giant stars that have lost their outer atmosphere and are now only a glowing stellar core. Red giant that loses outer atmosphere = white dwarf
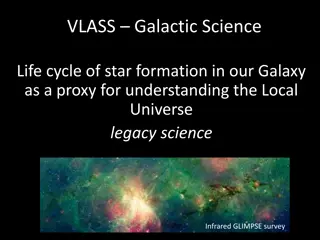
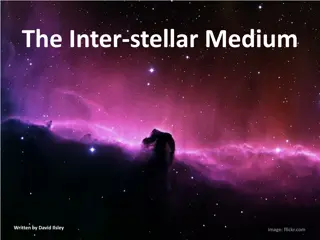
How Stars Form Collapsing gas and dust clouds. This picture is called the Pillars of Creation because new stars are being born in different parts of the nebula as the gas clouds collapse and begin spinning. 7000 Light Years away. Tallest Pillar is 4 Light Years High.
Flattening of the Solar Nebula As the nebula collapses, the wind created causes clumps of gas collide & merge. Swirling winds cause the nebula to assume the shape of a disk.
Protostar a developing star. Not yet a star. No nuclear fusion happening yet. The temperature continues to increase as the gas cloud compresses and spins faster and faster. Once the temperature reaches 10 Million Degrees Kelvin (18 Million Degrees Fahrenheit) then nuclear fusion begins and the star is born.
Lower Mass Higher Mass This diagram follows the life of both large and average stars. The life path of a star is dependent on the MASS of the star. Low mass stars take the top path. High mass stars take the bottom path.
Life cycle of our sun We are now here. Our sun is a small to average star. No supernova in the future. It will end as a white dwarf that eventually fades away.