Understanding Stellar Variability Effects in Exoplanet Studies
Exploring the impact of stellar variability on exoplanet transits and eclipses, this content delves into strategies for disentangling signals in phase curves. Factors such as stellar brightness, size, and stability play crucial roles. Illustrations and studies by Pont et al. shed light on phenomena like stellar spots and planetary Rayleigh scattering.
Download Presentation

Please find below an Image/Link to download the presentation.
The content on the website is provided AS IS for your information and personal use only. It may not be sold, licensed, or shared on other websites without obtaining consent from the author. Download presentation by click this link. If you encounter any issues during the download, it is possible that the publisher has removed the file from their server.
E N D
Presentation Transcript
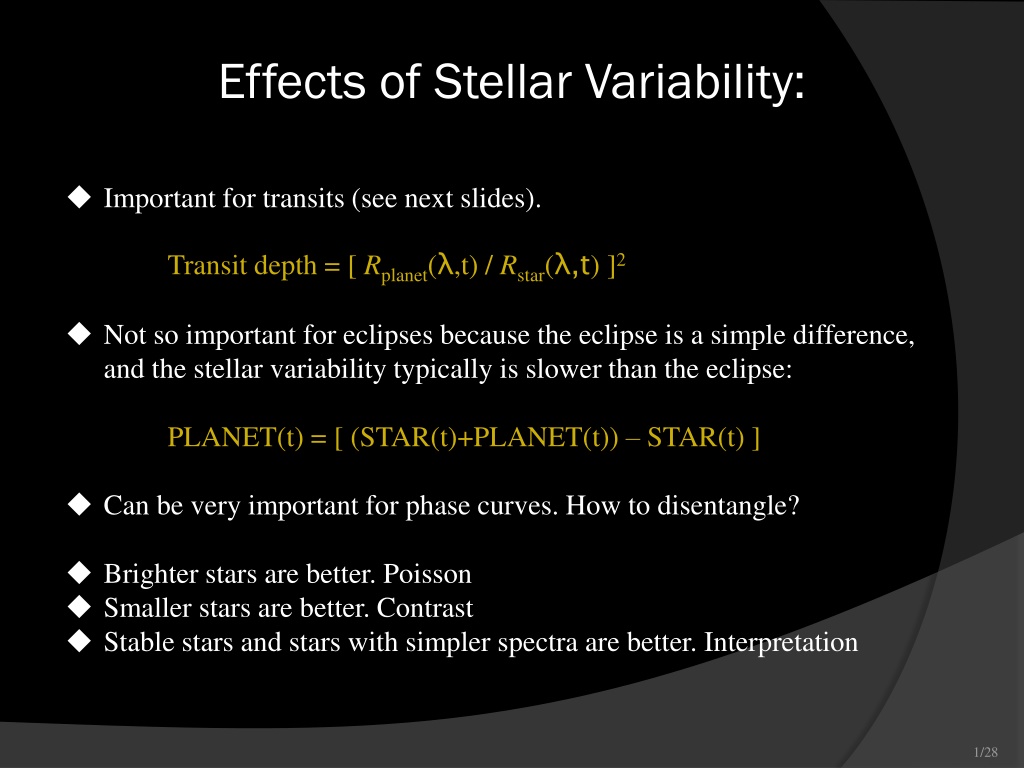
Effects of Stellar Variability: Important for transits (see next slides). Transit depth = [ Rplanet( ,t) / Rstar( ,t) ]2 Not so important for eclipses because the eclipse is a simple difference, and the stellar variability typically is slower than the eclipse: PLANET(t) = [ (STAR(t)+PLANET(t)) STAR(t) ] Can be very important for phase curves. How to disentangle? Brighter stars are better. Poisson Smaller stars are better. Contrast Stable stars and stars with simpler spectra are better. Interpretation 1/28
Pont et al. (2013) 2/28
Stellar Spots? HD 189733 K star Teff = 5000 K Correction required for unocculted spots: Sum of spot areas ~5% or ~2x area of planet Temperature of spots ~4000 K Illustration shows two dominant spots, but it could be a few or many smaller ones, possibly in bands (see inset) or polar spot(s). 4/28
Pont et al. (2013) 1.02 Stellar Flux 1.00 0.98 Time (total ~ 6 years)
Planetary Rayleigh Scattering? Pont et al. (2013) Effect on radius highly exaggerated. Lecavelier des Estangs et al. 2008 Pont et al. 2013 6/28
1.0% (open) and 1.7% (filled) spot corrections were applied to ACS data McCullough et al. 2014
