Best Practices for Including Code and Numerical Results in Statistics-related Dissertations

Include important code snippets in an appendix, describe work in detail in the main body, mention coding in introduction, present numerical results appropriately, format figures optimally for statistics-related dissertations.

Download Presentation

Please find below an Image/Link to download the presentation.
The content on the website is provided AS IS for your information and personal use only. It may not be sold, licensed, or shared on other websites without obtaining consent from the author. Download presentation by click this link. If you encounter any issues during the download, it is possible that the publisher has removed the file from their server.
E N D
Presentation Transcript
Code Code is best included in an appendix, not in the main body of the dissertation: Where projects contain a substantial amount of programming, candidates are encouraged to include key elements of their commented code in an appendix to the dissertation. This appendix will not contribute towards the word-count. This is saying you could include only important/representative examples of your code, not necessarily all of it Even if you do include code, you should describe your work in appropriate detail in the body of your dissertation (i.e. not in an appendix) so that the readers/markers of your dissertation can understand what you have done If there are important aspects to your code then you can also highlight these at the appropriate place(s) in the body of your dissertation
Code Maybe briefly mention what coding you did in the signpost section of the introduction, then explain more in the chapter(s) that need the code flagging that your code (or extracts of it) is in an appendix If you only used standard packages it s still probably a good idea to indicate what you used (maybe in the signpost section of the introduction?)
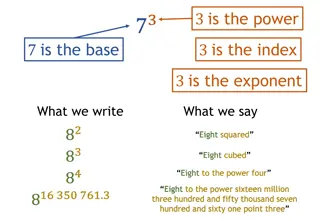
Numerical results Think about how to present numerical results Output should probably be formatted appropriately, not direct cut- and-paste And edited down to the parts you need, not everything R (or other software) gives you Give results to a sensible number of decimal places
Figures Not too big, not too small The text in figures should be about the same size as the main text, maybe a little smaller (but not too small to read) May need to be selective about which plots to include, which tables of results to include