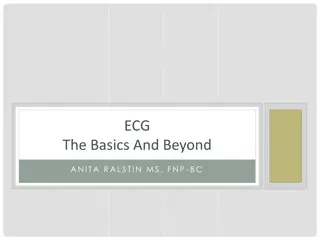
Understanding the Conduction System of the Heart and Electrocardiography
This laboratory focuses on the conduction system of the heart and electrocardiography, covering topics such as the anatomy of the internal conduction pathway, normal electrocardiogram interpretation, and the role of autorhythmic cells and pacemakers. The content also includes information on electrode placement for ECG readings and analysis of ECG waves, intervals, and segments during a cardiac cycle. Practical exercises using Biopac equipment are detailed, emphasizing proper calibration and data collection techniques.

Download Presentation

Please find below an Image/Link to download the presentation.
The content on the website is provided AS IS for your information and personal use only. It may not be sold, licensed, or shared on other websites without obtaining consent from the author. Download presentation by click this link. If you encounter any issues during the download, it is possible that the publisher has removed the file from their server.
E N D
Presentation Transcript
Laboratory 2 The conduction system of the heart and electrocardiography
Lab 2 Activities 1. Anatomy of the internal conduction pathway of the heart. 2. Biopac Exercise L05-ECG-1: Normal electrocardiogram (including the names of all waves, intervals, and segments, what they mean, and how they correlate to the parts of the cardiac cycle).
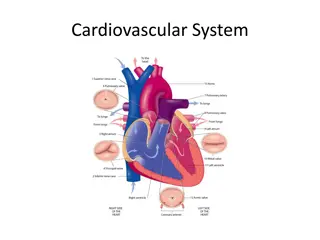
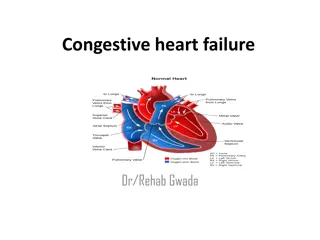
Conduction System and Pacemakers Autorhythmic cells Cardiac cells repeatedly fire spontaneous action potentials Autorhythmic cells: the conduction system Pacemakers SA node origin of cardiac excitation fires 60-100/min AV node conduction system AV bundle of His R and L bundle branches Purkinje fibers It s as if the heart had only two motor units: the atria and the ventricles!
The ECG: Electrode Placement Caution: Electrode clips are fragile; place cords where they will not be stepped on, in use, or when you are through!
The ECG Below are illustrated the waves (deflections) of a typical cardiac cycle. R 0.50 P T ECG mV 0.00 Q S 17.60 17.80 18.00 18.20 18.40 18.60 18.80 19.00 19.20 19.40 19.60 seconds
The ECG Waves, intervals and segments of one cardiac cycle are illustrated below. QRS complex R 0.50 P ECG mV T 0.00 Q PR (PQ) S ST Interval segment 17.60 17.80 18.00 18.20 18.40 18.60 18.80 19.00 19.20 19.40 19.60 seconds QT interval
BIOPAC NOTES During calibration: The subject should be sitting still, hands resting in lap or on knees- click Calibrate If the beginning of the baseline is decreasing, redo the calibration. The baseline should be more or less constant (horizontal) during calibration.
BIOPAC NOTES During data collection (record suspend resume) Treatment 1: Supine the bench top or three chairs or at least with feet elevated in a second chair; arms folded across waist if prone; breathing normally Click Record , after 20 seconds click Suspend Treatment 2: Sitting in a chair with arms at sides, hands in lap, feet on the floor and breathing normally Click Resume , after 20 seconds click Suspend --Treatment 3: Still seated, click on Resume as subject inhales and exhales deeply for 5 prolonged breath cycles. Recorder must press F4 at start of each inhale and F5 at start of each exhale. After the five breaths, record 5 more seconds then click Suspend Treatment 4:Exercise vigorously for 1 minute- heart rate should be elevated. As soon as subject is seated click on Resume for 5 minutes. Click Done. Choose Record from another subject , when each person is done then choose Analyze current data . Click Review Saved Data - find the Data files folder and your data with the ECG tracing.
BIOPAC NOTES Data Analysis Ensure the boxes at the top are as depicted by the red arrow Magnify image so that 2-3 cardiac cycles are visible.
BIOPAC NOTES Measure how long each event lasted Delta T: Delta = Change, T = Time The PR interval (PQ interval) is measured from the start of the P wave (not the top of P) to the start of the Q wave, but we will use Q, which is easier to identify
BIOPAC NOTES Measure how long each event lasted Be sure that you analyze and record results of 2 cardiac cycles for each treatment in your lab manual. Tables 1 and 2, page 2-7 Calculate the average of the 2 cycles! Do not select cardiac cycles that are right next to each other. Do your best to identify wave transitions. Be consistent!
BIOPAC NOTES Measure the BPM for the same two cardiac cycles for each procedure Use the I-beam to highlight one cardiac cycle and measure from the top of R to the top of R of the next cycle (R to R) to record the beats per minute rate for each treatment Record results from 2 cardiac cycles for each treatment segment in Tables 1 and 2. Calculate the average of the 2 cycles!
BIOPAC NOTES Cardiac Cycle Calculate by summing the appropriate intervals. Rounding Round your Delta T values for intervals and segments to two decimal places, e.g., 0.16. Round your BPM values for Heart Rate to one decimal place, e.g., 72.1.
Your Assignment Print a representative section (2-3 cardic cycles) of your ECG for the first set of treatment data (supine). Label the waves, intervals, and segments of a typical cardiac cycle on the ECG you print. Fill in Tables 1 & 2 as you analyze your data on page Lab 2-7 of your lab manual. Answer the questions on page Lab 2-8. No on-line homework this week.
BIOPAC NOTES Your graph should look like this. Then be sure you label the waves (P, Q-R- S, and T), intervals and segments (PR, ST, and QT) on the graph. 0.50 ECG mV 0.00 17.60 17.80 18.00 18.20 18.40 18.60 18.80 19.00 19.20 19.40 19.60 seconds