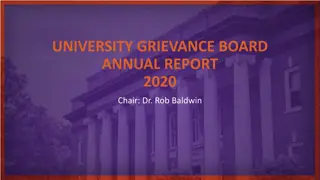
Overview of Annual Student Performance Report and NCLB Requirements
The report delves into the 2013 student performance focusing on the No Child Left Behind Act and Adequate Yearly Progress (AYP) requirements. It details the goals, target proficiencies, subgroup considerations, overall requirements, additional factors, and complicating factors affecting AYP achievement. The document also explains the reasons behind the raised cut scores, emphasizing college and career readiness alignment with standards.

Download Presentation

Please find below an Image/Link to download the presentation.
The content on the website is provided AS IS for your information and personal use only. It may not be sold, licensed, or shared on other websites without obtaining consent from the author. Download presentation by click this link. If you encounter any issues during the download, it is possible that the publisher has removed the file from their server.
E N D
Presentation Transcript
Annual Student Performance Report September 2013 1
Overview Review of NCLB requirements 2013 ISAT performance and AYP status Next steps 2
No Child Left Behind Act and Adequate Yearly Progress (AYP) Overall goal is 100% proficiency in Reading and Math by 2014 Targets increase nearly every year Recent target proficiencies: 2010: 77.5% 2011: 85% 2012: 85% (Illinois waiver) 2013: 92.5% 3
No Child Left Behind Act and Adequate Yearly Progress (AYP) 120 100 100 92.5 85 85 80 77.5 70 62.5 Target Percentage 60 55 47.5 47.5 40 40 40 20 0 4
Making AYP: Subgroups Target must be met by all subgroups: Ethnic group Economically disadvantaged Students with disabilities Limited English proficiency Applies to all subgroups with at least 45 members 5
Making AYP: Overall Requirements Three overall requirements: 1. At least 95% of students in each subgroup must be tested in reading and math. 2. At least 92.5% (in 2013) of students must meet or exceed standards in the subject. If the percentage is less than 92.5%, the 95% confidence interval is applied. If a subgroup did not make AYP the previous year, but decreased the percentage not meeting standards by at least 10%, the Safe Harbor provision will allow it to meet the conditions. 3. School must have at least a 92% attendance rate. 6
Making AYP: Additional Factors Annual target percentages are lowered in specific circumstances: 95% confidence interval based on group size Safe Harbor provision of 10% decrease in percent not meeting from one year to next 7
Making AYP: Complicating Factors Home school versus serving school May 1 attendance cutoff Some students in multiple subgroups 8
Why Cut Scores Were Raised Focus on college and career readiness Closer alignment to PARCC test Common Core State Standards set higher bar 9
Changes to Cut Scores Reading Math Grade 2012 2013 2012 2013 3 191 207 184 214 4 203 217 200 224 5 215 228 214 235 6 220 237 225 247 7 226 239 235 257 8 231 248 246 267 10
Student Progress: 2012-2013 Reminders: AYP compares different sets of students from year to year Vast majority of students do improve from one year to next 11
2013 Reading Compared to 2012 96.6 93.9 93.790.5 91.4 75.677.481.9 100.0 92.9 92.088.9 87.8 86.4 78.4 90.884.9 79.7 89.1 85.4 79.978.477.2 80.0 60.0 Spring 2012 40.0 Spring 2013 20.0 0.0 12
2013 Math Compared to 2012 92.7 91.594.9 93.8 93.7 95.1 98.3 96.5 96.990.4 91.4 76.679.8 78.483.3 74.570.3 100 84 84 82.8 76 80 72.2 60 40 Spring 2012 Spring 2013 20 0 13
Past Performance Under New Cut Scores 100 92 91 91 90 89 88 80 77 77 76 75 80 73 73 73 60 Old cut scores 40 New cut scores 20 0 2010 Rdg 2011 Rdg 2012 Rdg 2013 Rdg . 2010 Math 2011 Math 2012 Math 2013 Math 14
Disproportionate Effect on Subgroups Old cut scores New cut scores 15
2013 AYP Status One school made AYP in both subjects Nine schools did not make AYP in one or both subjects for one or more subgroups One failed for the third consecutive year One failed for the fourth consecutive year The District as a whole did not make AYP for the third consecutive year 16
2013 AYP Status: District 97 Subgroups Making AYP READING Subgroup % Meets or Exceeds Safe Harbor Target White students 90.0% 89.4% Economically disadvantaged students Spring break 52.4% 53.7% MATH Subgroup % Meets or Exceeds Safe Harbor Target Asian students 87.2% 89.3% Students of two or more races 79.5% 80.6% 17
2013 AYP Status: District 97 Subgroups Not Making AYP in Reading READING Subgroup % Meets or Exceeds Safe Harbor Target ALL students 79.7% 80.5% Black students 55.9% 57.7% Hispanic students 65.7% 69.4% Asian student 83.7% 90.6% Students of two or more races 80.8% 86.5% Students with disabilities 40.3% 48.1% 18
2013 AYP Status: District 97 Subgroups not Making AYP in Math MATH Subgroup % Meets or Exceeds Safe Harbor Target ALL students 76.6% 79.5% White students 88.0% 89.8% Black students 48.0% 54.7% Hispanic students 62.8% 71.9% Students with disabilities 38.2% 50.3% Economically disadvantaged students 47.1% 52.8% 19
2012 AYP Status Update 2013 State Status 2013 Federal Status SCHOO L Not Making AYP: Subjects and Subgroups Beye Math: White students Academic Early Warning: Year 2 Choice and SES Brooks Reading: Students with disabilities Math: All students, Black students, Students with disabilities, Economically disadvantaged students Academic Watch: Year 1 Does not apply Julian Reading: Students of two or more races, Students with disabilities Math: Students with disabilities, Economically disadvantaged students Academic Early Warning: Year 2 Does not apply District AYP status State: Academic Early Warning Year 2 Federal: District Improvement Year 2 20
Federal and State Requirements for Schools not Making AYP First year: No consequences Second consecutive year: Complete a School Improvement Plan and receive change in status: Federal (Title I schools): School in Need of Improvement (School choice) State: Academic Early Warning Status Year 1 Third consecutive year: Complete a School Improvement Plan and receive change in status: Federal (Title I schools): School in Need of Improvement (School choice and Supplemental Educational Services) State: Academic Early Warning Status Year 2 21
Student Growth Model Local growth model (ECRA) ISAT, MAP, EXPLORE, and DIBELS Uses past student performance to predict future Compares actual to predicted to identify areas needing attention 22
School Improvement Planning Rising Star plans at district level and all ten schools Continuous improvement model Focused on research-based indicators West 40 again engaged as consultant 23
Questions? 24