Performance Briefing on Agriculture, Forestry, and Fisheries Department - Annual Report 2016/17

This briefing highlights the performance assessment of the Department of Agriculture, Forestry, and Fisheries (DAFF) as per the 2016/17 Annual Report. It covers the context, purpose, and priorities for rural development, emphasizing outcomes related to inclusive rural economy and food security. Key focus areas include land administration, agrarian reform, food security, infrastructure access, and rural job creation. The presentation outlines goals, impact indicators, and targets set for comprehensive rural development and food security by 2019.

Download Presentation

Please find below an Image/Link to download the presentation.
The content on the website is provided AS IS for your information and personal use only. It may not be sold, licensed, or shared on other websites without obtaining consent from the author. Download presentation by click this link. If you encounter any issues during the download, it is possible that the publisher has removed the file from their server.
E N D
Presentation Transcript
BRIEFING ON THE PERFORMANCE ACCORDING TO BRIEFING ON THE PERFORMANCE ACCORDING TO THE ANNUAL REPORT 2016/17 OF THE DEPARTMENT THE ANNUAL REPORT 2016/17 OF THE DEPARTMENT OF AGRICULTURE, FORESTRY AND FISHERIES (DAFF); OF AGRICULTURE, FORESTRY AND FISHERIES (DAFF); AND MPAT RESULTS AND MPAT RESULTS A presentation by DPME to the Portfolio Committee on DAFF DR. NGOMANE T. OUTCOME FACILITATOR: RURAL DEVELOPMENT 10 October, 2017 1
Structure of presentation MPAT 2
Purpose & Context 1. To brief the committee on DPME s assessment on 2016/17 Annual performance of DAFF in preparation for the budget review and recommendation report. 2. The context: Government introduced the outcomes system in 2009 to achieve more effective spending and improved performance. DPME tracks government performance against 14 Outcomes. These outcomes are aligned to the National Development Plan (NDP) Vision 2030. Outcome 7: Comprehensive Rural Development and Food Security implements Chapter 6 of the NDP Vision 2030, with the Department of Rural Development and Land Reform (DRDLR) as the coordinating department supported by DAFF, and 20 other departments. The Outcome reports to Cabinet through the Economic Sectors, Employment and Infrastructure Development Cluster; Technical and Ministerial Implementation Forums The Annual Performance Plans of DAFF and DRDLR in particular, and by extension the Annual Reports must be aligned with Outcome 7. 3
Chapter 6 of the NDP on Inclusive Rural Economy Rural communities require greater social, economic and political opportunities to overcome poverty; Agricultural development should introduce a land-reform and livelihood strategies that ensures rural communities have jobs; Ensure quality access to basic services, healthcare, education and food security for all; Plans for rural towns should be tailor-made according to the varying opportunities in each area; and, Inter-governmental relations should be addressed to improve rural governance. 4
Priorities and Impact Indicators for Comprehensive Rural Development and Food Security (What we have committed to do by 2019) Six Priority Areas: 1. Improved land administration and spatial planning for integrated development in rural areas Four Impact Indicators: 1) Increase in the percentage of ownership of productive land by previously disadvantaged individuals (PDI) with 9.5%, or 7.83m ha 2. Sustainable agrarian reform 2) Reduction by 1 Mil ha the quantity of land transferred to PDIs that is underutilised 3. Improved food security 4. Smallholder development and support 3) Reduction in the percentage of households vulnerable to hunger (from 11.4% in 2011 to <9.5%) 5. Increased access to quality basic infrastructure and services 6. Growth of sustainable rural enterprises and industries job creation 4) Reduction in the rural unemployment rate (from 49.4% in 2013 to 40%). 5
Classification of performance for this report Target has been achieved, or Target has been exceeded, or Target has almost been achieved, or Target will be achieved by 2019 Green Amber Some progress/substantial progress towards meeting the target by 2019 Red No progress towards meeting the target by 2019 6
Outcome 7 : Comprehensive Rural Development Impact Indicators Baseline 2014 March 2019 Target Progress as at June 2017 Rating Impact Indicator Increase in % ownership of productive land by previously disadvantaged individuals (PDIs) 9% (7.39m ha) of total productive land by November, 2013 2 M ha 812 307ha (40.6%) acquired and allocated 441 534ha (44% of 1 M ha) to With overall performance at 40.6%, the target for 2019 will not be achieved. Zero allocation to farm workers out of the 20% targeted for 2019. A 2% decline from Q4 [56% to 54.2% (441 534 of 812 307 ha)] on land allocated to smallholders. 1 M ha to smallholders 200 000ha to farm workers and /or farm smallholders 100 042 ha (50% of 200 000 ha ) to farm workers [Source for the latter, DRDLR Mid-term Review, May 2017]. dwellers 4 m ha (4860 farms) transferred by March, 2013 are underutilised 1 million ha utilised by March 2019 1 125 534mil ha (112.5%) 346 924 ha (34.7% of the 1 M ha) targeted in communal areas, 231 370 ha thru RECAP, 547 230 ha thru 1H1H, (DRDLR May 2017). Reduce the number of ha of transferred land to PDIs which is underutilised 112.5% of the 1 mil ha of newly acquired land targeted to be utilised by 2019 exceeded. However, land cultivated under RECAP declined by 26.5% from 873 510 ha in Q4 to 231 370 in Q1. Reduction in the % of households vulnerable to hunger 11.4% in 2011 <9.5% by 2019 (10.5 % h/holds was achieved in 2007) 1.6 M households 4.3 M individuals by March 2019 H/holds vulnerable to hunger at 13.4% in 2016 from 29.3%, 2002 (GHS, 2017) 794 471 (49.7% of 1.6 M) h/holds 4 327 252 (100% of 4.3 M) individuals Though improved over the past 15 years, (From 23.8% hhs in 2002 StatsSA GHS, 2012) vulnerability to hunger has increased by 2% over the past 5 years, benefitted from from 11.4% in 2011 13.4% in 2016 Food & Nutrition Security programmes. 48% (StatsSA QLFS Q2, 2017) 49.4% rural unemployment in 2013 (Broad def. QLFS, 40% rural Reduction in the rural unemployment rate A decline of 0.4% from 47.6% in Q1. Agriculture lost 40 000 jobs. Notably, SA s economy lifted out of technical recession, with production growth rising 2.5% quarter-on-quarter, as compared to -0.6% in Q1, 2017. Agriculture the highest contributor at 33.6 % (Stats SA, Q2, 2017). unemployment by 2019 Q4, 2013) 27.7% overall unemployment Overall unemployment rate was at 21.5% in 2008. (QLFS, Q4, 2008) 7
Sustainable land reform for agrarian transformation Analysis Analysis contextualising differences between agrarian reform and land reform contextualising differences between agrarian reform and land reform 1. A key precondition for land reform to be feasible and effective in improving beneficiaries' livelihoods is for such programs to fit into a broader policy aimed at reducing poverty and establishing a favourable environment for the development of a productive smallholder agriculture (World Bank, 2003) 2. Whereas Land reform is concerned with rights in land, and their character, strength and distribution, agrarian reform focuses not only on these but also a broader set of issues i.e., the class character of the relations of production and distribution in farming and related enterprises, and how these connect to the wider class structure ( Cousins, 2016) 3. Reforming land policies serves to change relationships within and between communities, as well as between communities and the State, and can be an intensely political process, negatively impacting on performance 4. Agriculture is a catalyst for economic growth. The National Development Plan has identified primary agriculture as one of the key sectors for addressing food security, job creation and economic growth, especially for rural communities and small towns. 9
What the government set itself to do to achieve Agrarian Transformation 1. Chapter 6 of the NDP is the blueprint, implemented through Outcome 7 of the Medium Term Strategic Framework (MTSF) 2014-19: Comprehensive Rural Development and FS 2. The NDP 2030 envision inclusive rural areas where residents have economic growth, food security and jobs as a result of agrarian transformation and infrastructure dev. programmes. 3. In 2009, government committed itself to ensuring that the country has vibrant, sustainable rural communities --focussing on agrarian reform, improving households access to food, the range of services available to rural people, and rural job creation. 4. To further advance agrarian reform, the smallholder sector would be strengthened, increasing the number of smallholder farmers by 50 000, and ensuring that 30% of rural households are producing some food by 2014. 5. In the MTSF 2014 2019, government re-committed to the priorities aimed at achieving; Sustainable land reform contributing to agrarian transformation, and improved food security. Smallholder development and support for agrarian transformation. 10
What the government set itself to do for agrarian transformation Progress against the MTSF 2014-2019 as at 30 June 2017 Indicator 2014 level Target for 2019 Latest available measurement Rating Number of hectares (ha) of land newly acquired and allocated to PDIs 7.392 116 ha or 9.0 % (March 2014) An additional 2 Mil ha 812 307 ha (41 % of 2019 target of 2 Mil ha) DRDLR POA Q1 Report: Aug 2017 % of newly acquired ha of land allocated to smallholder producers New indicator 50 %, or 1 Mil ha of acquired land 441 534 ha (44 % of 2019 target of 1 Mil ha) DRDLR POA Q1 Report: Aug 2017 % of land allocated to people living & or working on farms (labour tenants, farm workers and dwellers) To be determined 10 % (200 000 ha) of acquired land 100 042 ha (50 % of 2019 target of 200 000 ha) DRDLR POA Q1 Report: Aug 2017 Overall performance should have exceeded 60% towards attainment on the 2019 targets. At the present performance of 41 and 44 %, the 2 targets rated Red are unlikely to be met. Much acceleration is required in implementing the 50:50 policy to improve on the 50% Amber. 11
What the government set itself to do for agrarian transformation Progress against the MTSF 2014-2019 as at 30 June 2017 Analysis Analysis Performance Performance is 1. The general pace of acquisition and allocation of strategically located land to increase percentage of land ownership by the previously disadvantaged individuals (PDIs), is slow. is slow slow 40.6% of target distributed since 2014 2. By June 2017, of the targeted 2 M ha of land, only 812 307 ha (40.6%) had been acquired and allocated overall since 2014. 3. About 441 534ha (44% of the 1 M ha) were allocated to smallholders, while 100 042 ha (50% of 200 000 ha ) were allocated to farm workers and/or dwellers. Performance on all 3 indicators should be over 60%. 2019 target to allocate 2 million ha to the PDIs unlikely to be achieved 12
What the government set itself to do for agrarian transformation Progress against the MTSF 2014-2019 as at 30 June 2017 Analysis Analysis continue 1. Only 14,8% of South African households were involved in agricultural production. Most crop production took place in backyard gardens [StatsSA GHS: 2016]. This is so despite the sector s contribution to the economy and food security. continue Few Few households households work work the the land land 2. Only 11,1% of households involved in agriculture reported getting agricultural- related support from government. Significant support was provided for farming households in KZN (16%), E. Cape (21,7%), and N. Cape (21,1%) [ibid] 3. A total of 1 125 524 ha of land is cultivated, 346 924 ha is cultivated in communal areas; 231 370 ha under the Recapitalisation and Development programme (RECAP) and 547 230 ha 1H1H Programme. 4. However, land cultivated under RECAP is declining due to the uncertainty around the transfer of the function from DRDLR to DAFF. The issue is receiving attention. 5. Only 2,2% of households reported receiving production training, while 7% reportedly received livestock vaccination services [StatsSA GHS: 2016]. 13
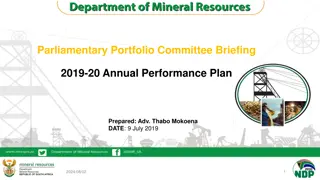
Black Farming Households with access to Agricultural Extension and/or Training 8% 7% 6% 5% 4% 3% 2% 1% 0% Eastern Cape Free State Gauteng KwaZulu Natal Limpopo Mpumalanga Northern Cape North West Western Cape Source: Statistics South Africa: General Household Survey, data amalgamated from 2012-2015 (with thanks to Prof. Michael Aliber, University of Fort Hare, for the calculations) 14
What the government set itself to do for agrarian transformation Progress against the MTSF 2014-2019 as at 30 June 2017 Analysis continue Analysis continue power dynamic in Land Redistribution power dynamic in Land Redistribution 1. State purchase of land means that budgets can be spent and land acquired without any redistribution of land rights taking place. 2. RECAP funds often benefit commercial strategic partners. 3. Land Redistribution is governed by state officials, consultants and agribusiness strategicpartners concerned with surveillance and control of beneficiaries in projects with precarious tenure on commercial farms--now owned by the State ( Hall, 2017). 4. While the State is playing a more interventionist role by purchasing land itself, it is not challenging the supremacy of private property, but rather becoming a significant player in the land market (ibid). 5. Without redistribution of power and wealth to those who are the ostensible beneficiaries, how then could sustainable Land Reform be achieved? 6. While land reform is a nationalcompetency implemented by the DRDLR, agriculture is a concurrent competency, with the provincial departments responsible for implementing farmer support. This dynamic is a major contributor to fragmentation and variations in farmer support programmes. 15
Sustainable land reform for agrarian transformation What is to be done? 17
Fast track implementation on the OPERATION PHAKISA: Agriculture, Land Reform and Rural Development, and the 9-Point Plan.
Operation Phakisa: Agriculture, Land Reform and Rural Development: 27 Phakisa Initiatives 6 Work Streams Optimising the Management of Natural Resources Funding and Finance Developing Skills and Capacity 7. Financial partnerships for accelerated and sustainable Land Reform (Land Reform) 1. Unlocking water to expand horticultural production (Horticulture) 3. Demand led public/ private agri-skills unit (Labour) 4. Livestock skills and knowledge upgrading programme (Livestock) 8. Re-engineering agricultural development finance (Producer Support) 2. Fortified veld management for sustainable livestock production (Livestock) 5. Enhanced animal health through revolutionary veterinary services (Livestock) 9. Unlocking finance for grains thru PPP (Grains) 10.Dynamic Business Model for Producer Support (Producer Support) 6. Ndimo Desk (Producer Support) Value Chain Development and Market Access 11.Access to commercial and alternative livestock value chains (Livestock) Reconfiguring Space & Promoting Functional Rural Settlement 23.Fast tracking the settlement of outstanding restitution claims in a sustainable manner (Land Reform) Coordination and Knowledge Management 16.Harmonization of legislation affecting the agricultural value chain (Producer Support) 17.Strategic leadership & coordination for structural transformation (Rural Development) 12.Integrated grain value chain (Grain) 24. Accelerated Land Development and Redistribution Initiative (ALDRI) (Land Reform) 18.District Land Reform Delivery Centre (Land Reform) 13.Inclusive horticulture value chain participation model (Horticulture) 19.National Agricultural Decent Work Programme (Labour) 25.Promoting and protecting rights of persons living under insecure tenure (Land Reform) 14.Rural enterprise development (Rural Development) 20.Strengthening legal compliance mechanisms (Labour) 26.Basic Services (Rural Development) 27.Farm worker house and land ownership programme (Labour) 15.Trade Promotion, Retention and Optimisation (Horticulture) 21.National livestock census, animal ID, & traceability (Livestock) 22.Grain Know How (Grains) 19
Improved Food Security Rating Indicator 2014 level Target for 2019 Latest available measurement 13.4% hhs (Stats SA GHS 2016) 11,4% in 2011 (23.8% hhs in 2002 (Stats SA 2013) <9.5% by 2019 (10.5% hhs achieved in 2007) Reduction in the % of households vulnerable to hunger Households vulnerable to hunger at 13.4% in 2016 from 29.3% in 2002 (StatsSA GHS, 2017) Though improved over the past 15 years, vulnerability to hunger has increased by 2% over the past 5 years, from 11.4% in 2011 13.4% in 2016 The Household Food Insecurity Access Scale, aimed at determining households access to food, indicate that the percentage of households with inadequate or severely inadequate access to food decreased from 23,9% in 2010 to 22,3% in 2016 This is largely due to social grant enabling purchasing of food rather than food production initiatives. 2015/16 drought has had a major impact on the affordability of maize, with the cost of a single serving of maize meal increasing by 43% --the cost of the staple food basket incr. by 22% (BFAP, 2017). 20
Improved Food Security: What is to be done? 1. Under the leadership of the Office of the Deputy President, an Intergovernmental Technical Working Group was constituted to develop a National Food and Nutrition Security Plan. 2. The Plan incorporates directives from Cabinet, provisions of the 2013 National Policy on Food & Nutrition Security, and findings of the Diagnostic Evaluation of Nutrition Interventions for Children under-5 3. The Plan is meant to intensify efforts to reduce vulnerability of individuals with limited access through improved information management, appropriate policies and targeted interventions across government, private sector and community based organisations. 4. 5. 6. Integrated interventions will be overseen by a Council and led by the Deputy President. The process of costing activities of the plan is currently under way Finalization and implementation of the National plan of Food and Nutrition Security in an integrated manner is essential and urgent. 21
Food Security interventions need to be intensified for visible impacts Only 2.3 mil households are participating in 13.4% households are vulnerable to hunger agriculture 22
Smallholder producers development and support for agrarian transformation (1) Indicator 2014 level Target for 2019 Latest available measurement Rating Policies promoting the development and support to smallholder producers in place and implemented Food Security and Nutrition policy and strategy, and draft Agricultural Policy Action Plan (APAP) Smallholder producers policies implemented The draft Comprehensive Producer Development Support Policy approved and under consultation (DAFF) Number of hectares under irrigation used by smallholder producers 1559 ha (POA August 2017) An additional 1250 ha under irrigation 435.5 ha of land under irrigation used by smallholder producers Number of projects to support revitalization of irrigation schemes implemented Irrigation strategy 181 projects Rehabilitation of the Vaalharts Irrigation scheme is in progress. To be determined An additional 80 000 small holder producers receiving support 2 514 smallholder producers were supported (POA Q1, 2017/18) Total since 2014, 192 929 smallholders supported (Midterm Review Report May, 2017) Number of smallholder producers receiving support 23
Smallholder producers development and support for agrarian transformation (2) Though the performance on number of smallholder producers receiving support is rated as green, there are areas of concern, namely; 1. The recovery from the drought will take more than one season. This is especially true for the livestock sector, where herd numbers will have to be rebuilt and a recovery in pasture quality takes time. 2. The situation in the Western Cape remains dire with major long-term impacts due to severe restrictions on the availability of water for irrigation of high-value crops. 3. Other actions to increase number of hectares under irrigation are not fully reported, e.g., according to the 2017 Midterm Review Report, by end 2015/16 267 water use licenses were allocated to PDIs ; 2 862 resource poor farmers received support to access water 247 rain water harvesting tanks were distributed, and 241 projects were implemented to revitalize irrigation schemes. 24
Rural unemployment Impact Indicator Reduction in the rural unemployment rate 2014 Baseline 49.4% rural unemployment in 2013 (Broad definition StatsSA QLFS, 4th Quarter: 2013) 2019 Target 40% rural unemployment by 2019 Latest available measurement 48% rural unemployment (StatsSA Q2, QLFS:2017) Analysis: To reduce rural unemployment from 49.4% to 40% by 2019, the impact was minimal. Rural unemployment @ 48%, which is a decline of 0.4% from 47.6% in Q1. During 2016, the real growth of Agriculture was negative, but the good rains at end on 2016 resulted in real growth of 23.1% (q1) and 33.6% (q2). This contributed to the that the economy was lifted out of the technical recession. Agriculture the highest contributor (Stats SA, Q2, 2017). The contribution of primary agriculture to GDP is low however, the broader agro-food complex contributes about 12% to GDP. Agriculture lost on y-o-y bases 40 000 jobs in the last quarter (QLFS Q2 2017). What is to be done? 1. Stimulate Agriculture as a growth sector through investments, for agriculture delivers more jobs per rand invested than any other productive sector and remains crucial in the face of rural poverty and food insecurity 25
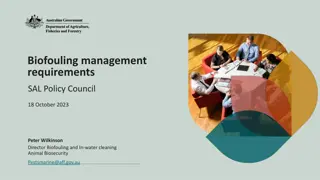
Agriculture contribution to GDP compared to other sectors The Agricultural sector is one of the main contributors to getting the economy out of the technical recession. 26
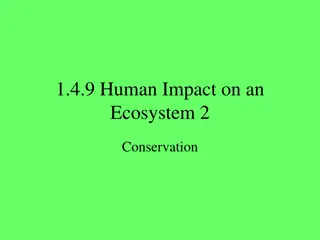
Agriculture lost 40 000 jobs: Q4, 2017 Fastest growth in high-value export crops in Limpopo Major losses in KZN due to sharp drop in sugar production Change in the number of persons employed by province: 2008 vs 2015 Source: QLFS, 2008-2016 BFAP: Sep. 2017 28
The Comprehensive Support Programme (CASP): Objectives CASP sets out to deliver a wide range of economic, social and environmental benefits On the economic front : To produce higher levels of productive efficiency, create on-farm and off-farm jobs, increase income and wealth in the rural economy Attract significant amounts of domestic and foreign investment to complement the initial capital injections through the programme Reversal of the inequities in farmland access and use rights inherited from the apartheid era. In terms of Social Benefits : Its contributions to household and national food security should significantly add to poverty reduction and improve rural living standards; reduce crime, violence and socio- political instability resulting from conflict over limited agricultural resources Pertaining to Environment, CASP supposedly promotes ecologically sustainable farming. 29
Employment figures: CASP Conditional Grant 2016/17 (CASP report 2016/17) Analysis 7 894 (80%) jobs were created on-farm against a target to create 9 858 jobs More temporary 5 484 (69%) than permanent 2 410 (31%) jobs due to the seasonality of the sector More males 4 216 (53%) received employment as compared to 3 678 (47%) females The youth made up 25% (1 966) of people employed KwaZulu Natal reported more jobs created (2 868) followed by Western Cape (1 712). 30
CASP Support and Appropriateness - Infrastructure CASP has made a significant contribution to on-farm infrastructure Infrastructure includes; sheds & storage places, pack houses, dairy & piggery infrastructure, hydroponic tunnels, chicken houses, fencing water tanks, windmills & shade netting CASP intervention not associated with an increase in residential infrastructure Clearly the focus is on production rather than social Source: DPME Impact Evaluation on CASP, 2014 31
Introductory overview MPAT has been implemented to facilitate reforms in management practices in government departments. It was designed to complement the systems approach by ensuring a Capable Public Service as envisaged by the NDP. NDP identified the need to have focused initiatives in Building a Capable state and acknowledges that although government had intervention in this regard, it was not integrated and did not have a long term focus. The tool identified at the onset that whilst there are notable improvements in management in the Public Service, these have not reached the desired levels. The lessons learnt from MPAT case studies show that weak managerial- leadership practices still persist in the public service and the need for a holistic approach for dealing with these in order to enable Public Service to improve performance in service delivery. 34 34
AnalyticalFramework The MPAT score is analysed within the following 3 dimensions: Comparisons with other data MPAT scores with PERSAL, Annual Report and other data Changes over time The changes are analysed overall, by KPA and standards Comparisons with other department, sectors, provinces and total RSA Overall, by KPA and Standards 35 35
Trend Analysis of Average Scores across KPAs Although the department experienced overall incremental improvement from MPAT 1.4 to MPAT 1.6 , the department is scoring slightly below the compliance level in Governance and Accountability and Human Resource Management KPAs. 36
MPAT 1.6 Average scores for Strategic Management KPA For the Strategic Management KPA, the department s average scores improved significantly from non-compliance score of 2 in MPAT 1.4 results to slightly above compliant score of 3,5 in MPAT 1.6 results. This is commendable. 37 37
MPAT 1.6 Average scores for Governance and Accountability KPA Although the department s total average scores improved from 1,6 (in 2014) to 2,8 (in 2015), the average scores regressed to 2,1 in 2016 There is sharp regression on Fraud prevention, Corporate Governance of ICT, PAIA and PAJA. Main attributes includes irreverent provision of evidence and to little or no evidence submitted to substantiate departmental view. 38 38
MPAT 1.6 Average scores for Human Resource Management KPA Although the department KPA average scores regressed in 2015, there was slight improvement in 2016 even though the scores were below compliance level. The department is compliant with policies in Human Resource Planning, Organisational Design, Human Resource Development, Recruitment, and PSA Delegations. However, the department is consistently non-compliant in the following areas: o Management structures, Employees Health and Wellness, Level 1-12 PMDS, SMS PMDS, PMDS HOD, and disciplinary cases. The department needs to put improvement plans in place and monitor it regularly to enable progression in the next cycle. 39
MPAT 1.6 Average scores for Financial Management KPA The 2016 average score for the Financial Management KPA for DAFF was 3.8. With the exception of Payment of Suppliers, DAFF has been scoring within the compliance levels for financial management. 40 40
SCORECARD MPAT 1.4 - MPAT 1.5 MPAT 1.6 Change from previous year MPAT 1.6 RSA Average Deviation from RSA Average 1 Strat Mgt 1.1.1A Strat Plans 1.1.1B Strategic Plans 1.1.2A APP 1.1.2B APP 1.3.1 Monitoring 1.3.2 Evaluation 2 Gov and A cc 2.1.1 Serv del impr mech 2.2.1 Mgt struct 2.3.2 Account Audit Comm 2.4.1 Prof ethics 2.4.2 Fraud prev 2.5.1 Internal audit 2.6.1 Risk Mgt 2.8.1 Corp Gov ICT 2.10.1 Prom Acc Inf 2.11.1 PAJA 3 HR Mgt 3.1.1 HR Planning 3.1.2 Org Design 3.1.3 HR Dev Plan 3.2.2 Recruit and reten 3.2.4 Mgt diversity 3.2.5 EH&W 3.2.6 Deleg PSA 3.3.1 Level 1-12 PMDS 3.3.2 SMS PMDS (ex HODs) 3.3.3 PMDS HOD 3.4.2 Discipl cases 4 Fin Mgt 4.1.1 Demand Mgt 4.1.2 Acquisition Mgt 4.1.3 Logistics mgt 4.1.4 Disposal mgt 4.2.1 Cash flow 4.2.2 Paymt of suppl 4.2.3 Unauthorised Etc 4.2.4 Pay sheet cert 4.2.5 Deleg PFMA Department Average 2,0 2,0 - 1,0 - 3,0 - 1,6 1,0 2,0 2,0 2,0 2,0 2,0 2,0 1,0 1,0 1,0 2,9 4,0 3,0 3,0 2,0 2,0 2,0 4,0 4,0 4,0 2,0 2,0 3,6 4,0 3,0 3,0 3,0 4,0 4,0 4,0 3,0 4,0 2,6 2,4 3,0 3,0 1,0 4,0 2,5 1,0 2,8 2,5 2,0 2,0 3,0 4,0 1,0 1,0 4,0 4,0 4,0 2,4 3,0 2,5 2,5 2,5 1,0 1,0 4,0 3,0 2,0 2,5 2,0 3,4 3,0 4,0 4,0 3,0 3,0 2,5 3,0 4,0 4,0 2,7 3,5 - 4,0 - 4,0 3,0 3,0 2,1 2,5 2,5 2,0 2,0 2,5 2,0 3,0 2,0 1,0 1,0 2,7 3,0 3,0 3,0 3,0 2,5 2,0 4,0 2,0 2,5 2,5 2,0 3,8 4,0 4,0 4,0 4,0 4,0 2,0 4,0 4,0 4,0 2,9 1,1 2,8 - - - 3,1 2,9 2,3 3,0 2,6 3,3 3,6 3,0 2,9 3,4 3,2 3,0 3,1 2,4 2,6 2,8 2,3 3,1 2,8 2,3 3,1 2,8 2,3 2,4 2,4 2,1 3,2 3,2 3,5 3,2 3,2 3,6 2,3 3,1 3,3 3,8 2,7 0,7 - 4,0 - 0,9 0,1 0,7 -0,9 -0,1 -0,8 -1,6 -1,0 -0,4 -1,4 -0,2 -1,0 -2,1 -1,4 0,1 0,2 0,7 -0,1 0,2 0,2 -1,1 1,2 -0,3 0,1 0,1 -0,1 0,6 0,8 0,5 0,8 0,8 0,4 -0,3 0,9 0,7 0,2 0,0 1,0 - 0,5 2,0 -0,7 - 0,5 - -1,0 -1,5 1,0 2,0 -2,0 -3,0 -3,0 0,3 - 0,5 0,5 0,5 1,5 1,0 - -1,0 0,5 - - 0,4 1,0 - - 1,0 1,0 -0,5 1,0 - - 0,2 44
General MPAT 1,6 Observations 1. The department is commended for its incremental progress in Financial and Strategic Management KPAs. 2. Although Governance and Accountability has shown improvement from 2015 to 2016, the KPA average scores regressed in 2016. Measures need to be put in place to ensure compliance to prescripts and policies and that systems and processes are in place to guard against regression. 3. Although Human Resource Management KPA still performs below the compliance level, there are positive signs for improvement in future. The department need to put measures in place to ensure improvements in this area. 4. The department should identify the key areas of weakness and capture these in an improvement plan and ensure monitoring in-year. This will assist the department to improve on the areas of weakness. 42 42
Managing Public Entities Six public entities account to the Minister. These are o Agriculture Research Council, o Onderstepoort Biological products, o National Agriculture Marketing Council, o Ncera farms o Perishable Product Export Certification Board, and o Marine Living Resources fund They play a vital role in support of the department and performance on Outcome 4 and 7. However, the current assessment of DAFF presumably include the contributions by these entities. DPME is in a process of developing guidelines for purposes of assessing the performance of SOEs, independently. 43
Auditor-Generals findings: 2016/17 Report 1. 2. Unqualified audit opinion for 2016/17 in respect of the financial information Irregular and fruitless expenditure to the amount of R2,806 million and R380 thousand, respectively, were identified in the 2016/17 financial year. Capacity to spent is limited with DAFF spending R 6.490 827 bn to the end of 2016/17 FY out of a budget of R 6.514 965 bn (99.6%) leaving funds unspent of R 24.1 million (DAFF Annual report 2016/17). E.g., The expenditure to the amount of R23,014 million for capital works in respect of the Stellenbosch-Plant Quarantine Station: upgrading and maintenance of building and laboratories and other capital works projects not incurred owing to the delays in the Department of Public Works processes. Expenditure to the amount of R5,936 million in respect of CASP Indirect Grant: Fodder for animal feed was not fully incurred owing to delay in distributing fodder to Northern Cape farmers following the late implementation of SCM by the Northern Cape Province. 4. Leadership Management did not adequately oversee performance planning and compliance to ensure that performance targets were specific in clearly identifying the nature and required level of performance. Action plans for the implementation of audit recommendations was not adequately monitored, resulting in a recurrence of material audit findings. 5. Financial and performance management The department did not always implement adequate reviewing and monitoring controls over information received from the branches and regions for reporting purposes. This resulted in the performance report and financial statements being subjected to material corrections after having been submitted for auditing. 3. 44 44
Concluding comments Though the department has embarked on some strategies (such as mechanization and drought assistance) aimed at stimulating production by smallholders, DAFF s programmes are not having significant impact on key indicators : Transforming the sector through new entrants becoming successful commercial farmers. Some support packages offered by government tend to cause dependency. Growth of the industry both in terms of contribution to GDP and employment Household food security, and utilisation of agricultural land and participating in agricultural production activities Causes of the problem appear to include weak relationships between government and the industry, and high senior management vacancy levels The uncertainty regarding the transfer of RECAP is impacting negatively on the ha of land cultivated by PDIs and threatens FS 45
Recommendations Greater effort is needed to improve performance towards the MTSF 2019 targets so as to ensure reasonable achievement on land reform for agrarian transformation, on food and nutrition security, and on rural enterprises development It is imperative to intensify our collective efforts in this regard, given the rising levels of poverty from 11 to 14 Mil people as recently reported by Stats SA (GHS: August, 2017) The 3-feet plans of Operation Phakisa on Agriculture, Land Reform and Rural Development should be implemented. 46
I Thank You Go to http://www.dpme.gov.za for PME documents including narrative guide to outcomes approach, outcomes documents and delivery agreement guide I thank you Direct contact: Dr Ngomane T. Outcome Facilitator Rural Development Tsakani@dpme.gov.za Tel: +27 012 312 01112 47


: Objectives")