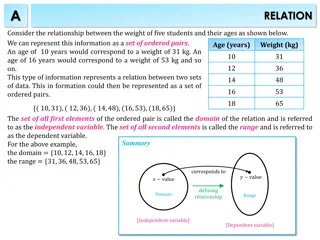
Enhancing Precision and Accuracy in Trace Element Analysis Using EPMA Techniques
This research focuses on improving precision and accuracy for trace elements through advanced methods like MAN (mean atomic number) and MPB (multi-point background). By optimizing background measurements and calibration techniques, researchers aim to enhance the sensitivity and reliability of trace element analysis in complex systems.

Download Presentation

Please find below an Image/Link to download the presentation.
The content on the website is provided AS IS for your information and personal use only. It may not be sold, licensed, or shared on other websites without obtaining consent from the author. Download presentation by click this link. If you encounter any issues during the download, it is possible that the publisher has removed the file from their server.
E N D
Presentation Transcript
Improving Precision and Accuracy for Trace Elements in EPMA J. J. Donovan University of Oregon, CAMCOR, Eugene, OR 97403-1253
Traditional Off-Peak Methods Bgd high Bgd low
Two solutions: MAN and MPB MAN (mean atomic number) Measure the on-peak background in (standard) materials that do not contain the element of interest Correct for continuum absorption and fit to average Z MPB (multi point background) Measure the off-peak background at more than two positions Fit to polynomial or exponential expression
MPB (multi-point backgrounds) provide accurate trace analysis background measurement, especially in complex systems DyL 1 peak FeK Jercinovic et al. 2012, Mater. Sci. Eng. 32, 012012
Manual or automatic optimization, with many useful features for trace element evaluation background interference peak intensity x-ray line markers background intensities (circled currently used for fitting) List of datasets wavescan overlay data rows in dataset Measured elements, Ag L selected
Shared MPB ? ? ? ?
MAN (mean atomic number) background calibration By prior determination of continuum intensities in a variety of materials (over a range of average atomic number)that do not contain the element of interest, the matrix iteration can quantitatively calculate the background intensity from the unknown specimen composition. Since no off-peak measurements are utilized, time is saved resulting in less sample damage and elimination of possible off-peak interferences. This is a significant acquisition time advantage for major and minor elements. and also results in improved trace element sensitivity Donovan, et al., Amer. Min., 2016
Comparing MAN and Off-peak Measurements (same dataset) No Blank Correction Blank Correction
On and off peak variances add in quadrature! = + 2 P 2 B P B When we directly measure the background intensities, we introduce additional imprecision to the net intensity calculation. If only there was a method to determine the continuum background intensities *without* a direct measurement How about the MAN background method?
Calculating the variance of the average atomic number, Z-bar: 2+ ?? ??? 2 ? ?= ?1 ??1 or ? ?= ?? ??? ? The total MAN variance is therefore the average Z variance (for measured elements) plus the regression variance, correct? 2 2 + ( ? ??)2+ (1 ??)2 ?? ???= ? ????? ? Model A
Off-Peak Background Correction (calculated background pixels) Th Hf U P Y Cps/nA Average .226061 2.02225 .611455 .320043 .113804 Std Deviation .028376 .142604 .128880 .037488 .021821 Off-peak Model .027325 .081837 .044766 .032520 .019335 = + 2 P 2 B P B MAN Background Correction (fixed ZrSiO4 matrix) Th .254557 .000348 Hf 2.04241 .001509 U .630875 .002499 P .280978 .000904 Y .113875 .000156 Average Std Deviation MAN Model (A) MAN Model (B) .025887 .076575 .026831 .017200 .006861 .000328 .001510 .000612 .000265 .000095 MAN Background Correction (measured ZrSiO4 matrix) Th .254586 .000812 Hf 2.04253 .002682 U .630940 .002897 P .281020 .001754 Y .113894 .000683 Average Std Deviation MAN Model (A) MAN Model (B) .027446 .083754 .029741 .018462 .007315 .001886 .008685 .003521 .001526 .000549
MAN Variance Models 2 2 + ( ? ??)2+ (1 ??)2 ?? ???= ? ????? ? Model A MAN regression precision is actually an accuracy issue!* Unless we remeasure our MAN curve for *every* point or pixel! 2 ?? ???= ? ????? ? Model B
Natural Quartz Quant mapping
Natural (Toba) Zircon ~20 hours ~10 hours
Off-peak measurements = worse sensitivity in twice the time!
20 nA, 0.5 sec per pixel 14.8 wt% (publ.)


 provide accurate trace")


 background calibration")
")