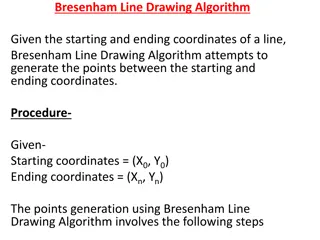
Understanding Trace Tables for Algorithm Testing
Trace tables are a valuable technique used to test algorithms step by step and identify logic errors. They involve using truth tables to track variable values or conditions. This content provides insights into trace tables, correcting errors in pseudocode, using examples for variable tracking, and completing trace tables for flowcharts.

Download Presentation

Please find below an Image/Link to download the presentation.
The content on the website is provided AS IS for your information and personal use only. It may not be sold, licensed, or shared on other websites without obtaining consent from the author. Download presentation by click this link. If you encounter any issues during the download, it is possible that the publisher has removed the file from their server.
E N D
Presentation Transcript
Trace tables https://www.cleverrevision.com
Starter There are some in errors in the pseudocode. Re-write the corrected version. https://www.cleverrevision.com
Trace tables A trace table is a technique used to test algorithms to understand or predict what an algorithm is doing step by step and to identify potential logic errors. A truth table can be used to find the values of variables or conditions at each step or to determine the output for a known set of data to check it carries out the task correctly https://www.cleverrevision.com
Using trace tables Example of the use of trace table to check the values of variables as they change. LINE NUM X OUTPUT 1 4 2 4 NUM 4 1. 3 1 2. OUTPUT NUM FOR X 1 to 3 NUM NUM + 5 4 9 3. 5 9 4. 3 2 5. OUTPUT NUM 4 14 6. NEXT 5 14 7. OUTPUT Finished 3 3 4 19 5 19 6 7 Finished https://www.cleverrevision.com
Complete the trace table for the flowchart below for an input X = 85 X N T X < 1 OUTPUT https://www.cleverrevision.com
Complete the trace table for the flowchart below for an input X = 85 Complete the trace table for the flowchart below for an input X = 85 - - Solution Solution X N T X < 1 OUTPUT 85 1 85 8.5 false 2 0.85 85, 2 https://www.cleverrevision.com
Complete the trace table for the flowchart below for an input X = 3190 and input X = -40 X N T X < 1 OUTPUT https://www.cleverrevision.com
Complete the trace table for the flowchart below for an input X = 3190 and input X = -40 - Solution X N T X < 1 OUTPUT 3190 1 3190 false 319 2 false 31.9 3 false 3.19 4 false 0.319 true 3190, 4 -40 1 -40 -4 true -40, 1 https://www.cleverrevision.com
Complete the tasks in your work area https://www.cleverrevision.com