Understanding Crop Coefficients in Colorado
Explore the application of crop coefficients for estimating crop evapotranspiration in Colorado, specifically at the Rocky Ford Lysimeters. Learn about the measurement methods, instrumentation used, and data collected through lysimeter projects. Gain insights into the Kcr curves for alfalfa hay and how they vary across different cutting cycles.

Download Presentation

Please find below an Image/Link to download the presentation.
The content on the website is provided AS IS for your information and personal use only. It may not be sold, licensed, or shared on other websites without obtaining consent from the author. Download presentation by click this link. If you encounter any issues during the download, it is possible that the publisher has removed the file from their server.
E N D
Presentation Transcript
Crop Coefficients for Colorado: The Rocky Ford Lysimeters Allan Andales Assistant Professor and Extension Specialist Soil and Crop Sciences Department Colorado State University
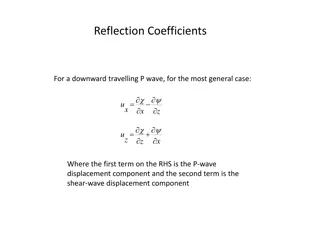
Estimation of crop evapotranspiration (ETc) ETc = ETrs x Kcr where ETrs = reference crop ET (tall reference like alfalfa) = the ET rate from a uniform surface of dense, actively growing vegetation (hypothetical crop) having specified height (50 cm or 20 inches for alfalfa) and surface resistance (to vapor transport), not short of soil water, and representing an expanse of at least 100 m (328 ft) of the same or similar vegetation (ASCE-Standardized Reference ET equation) Kcr = crop coefficient based on tall reference c c ET ET ET ET = rs rs
Crop lysimeter and instrumentation Precipitation Radiation (Rs, Rn, PAR) Temperature (air, canopy, soil) Wind (speed, direction) Humidity (ea) Atmospheric pressure Soil water content (Neutron probe) Soil heat flux ET(atmometer)
Lysimeter project at Rocky Ford One reference lysimeter (1.5 m x 1.5 m x 2.4 m) to measure ETr (completed in 2009) One crop lysimeter (3.0 m x 3.0 m x 2.4 m) to measure ETc (completed in 2006) Network of 12 weather stations along the Arkansas Valley (part of COAgMet) Lysimeters located at CSU-Arkansas Valley Research Center (AVRC), Rocky Ford, Colorado 1,274 m (4179 ft) above MSL 300 mm (11.8 in) avg. annual precip. Rocky Ford clay loam soil
Example lysimeter load cell output June 7, 2008
Alfalfa hay raw Kcr curve in 2008 (cutting cycles 2, 3, and 4) Evaporation from surface wetted by rainfall 2.0 1.8 1.6 1.4 1.2 Kcr 1.0 0.8 0.6 0.4 0.2 0.0 160 180 200 220 240 260 280 300 Day of year
Alfalfa hay raw Kcr curve in 2009 (4 cutting cycles) 1.4 1.2 1.0 0.8 0.6 Kcr 0.4 0.2 0.0 80 100 120 140 160 180 200 220 240 260 280 Day of year
Fitted Kcr curve for 2nd alfalfa cutting in 2008 1.4 1.2 1.0 0.8 Kcr y = -0.00176x2+ 0.66938x - 62.47402 R = 0.95 0.6 0.4 0.2 0.0 160 170 180 190 200 210 Day of year
14 12 Reference ET (mm/day) 10 8 6 4 2 14 0 12 160 170 180 190 200 210 Crop ET (mm/day) 10 Day of year 8 ETrs x Kcr = ETc 6 4 2 1.4 0 1.2 160 170 180 190 200 210 1.0 Day of year 0.8 Kc 0.6 0.4 0.2 0.0 160 170 180 190 200 210 Day of year
Acknowledgements Funding provided by the Colorado Water Conservation Board, the Colorado Agricultural Experiment Station, Colorado Water Institute, and the Colorado Division of Water Resources Technical assistance provided by USDA-ARS (Fort Collins, CO and Bushland, TX) Collaborators: Lane Simmons1, Mike Bartolo1, Dale Straw2, Tom Ley2, Abdel Berrada1, Lee Sommers1, Reagan Waskom1, Frank Johnson1, Hamdan Al Wahaibi1, Jos Ch vez1, Tom Trout3 1Colorado State University 2Colorado Division of Water Resources 3USDA-ARS

")