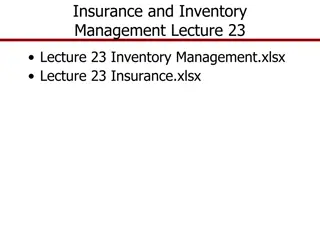
Understanding Federal Crop Insurance in Agricultural Systems Management

Explore the current crop insurance programs for major crops, including different insurance options, how they work, and the decisions farmers make. Gain insights into CBO projected USDA spending, trends in WI crop insurance participation, and comparisons with neighboring states. Learn about the types of crop insurance policies available and the choices farmers have to make when selecting a policy. Find out where to start if you're interested in crop insurance and the key decisions to consider for corn and soybeans.
- Crop Insurance
- Agricultural Systems Management
- USDA Spending
- Crop Insurance Programs
- Crop Insurance Options

Download Presentation

Please find below an Image/Link to download the presentation.
The content on the website is provided AS IS for your information and personal use only. It may not be sold, licensed, or shared on other websites without obtaining consent from the author. Download presentation by click this link. If you encounter any issues during the download, it is possible that the publisher has removed the file from their server.
E N D
Presentation Transcript
FEDERAL CROP INSURANCE AAE 320: Agricultural Systems Management Paul D. Mitchell Agricultural and Applied Economics
Learning Goals Overview current crop insurance programs for major crops What the various crop insurance options are How the various options work The choices a farmer makes when using crop insurance
CBO Projected USDA Spending 12 Crop Insurance Commodity Support Conservation Programs Government Spending ($B) 10 8 6 4 2 0 2021 2022 2023 2024 2025 2026 2027 2028 2029 2030 2031 2032 https://www.cbo.gov/system/files?file=2022-05/51317-2022-05-usda.pdf
Trends in WI Crop Insurance Participation 85% Corn Soybeans % Planted Acres Insured 80% 75% Corn & soybeans have averaged 76% & 78% for the last 3-5 years 70% 65% 60% 2006 2008 2010 2012 2014 2016 2018 2020
WI vs. neighboring states % planted acres insured in 2020 State IA IL MN MI WI Corn 97% 96% 99% 87% 78% Soybeans 96% 93% 97% 82% 79% Wheat 23% 86% 98% 81% 58%
WI vs. neighboring states % planted acres insured in 2020 100% % Acres Insured in 2020 80% 60% 40% 20% 0% IA IL MN MI WI Corn Soybeans Wheat
Crop Insurance Suppose I m interested: Where do I start? Contact a crop insurance agent! They all sell exactly the same polices for exactly the same prices You are buying service Find someone you like to work with For corn and soybeans: Choices you make 1. What policy to buy? 2. What coverage level to chose? 3. What unit structure to use?
Types of Crop Insurance Policies Farmers have four policy choices for most crops Are exceptions for regionally minor crops Yield Insurance vs Revenue Insurance What triggers a payment? Yield or Revenue below the guarantee Individual vs. Area-Wide Coverage Whose yield/revenue triggers payment? Your own or your county s
WI Crop Insurance Policies: Corn & Soybeans Individual (Farm) Area-Wide (County) So Many Options!! YP AYP Yield Yield Protection RP Revenue Protection Area Yield Protection ARP Area Revenue Protection Revenue RP-HPE: Harvest Price Exclusion ARP-HPE w/ Harvest Price Exclusion Catastrophic coverage (CAT): Special type ofYP, AYP Whole-Farm Revenue Protection: Insure Schedule F income
WI Crop Insurance Policies: Corn & Soybeans Individual (Farm) Area-Wide (County) So Many Options!! YP AYP Yield Yield Protection RP Revenue Protection Area Yield Protection ARP Area Revenue Protection Revenue RP-HPE: Harvest Price Exclusion ARP-HPE w/ Harvest Price Exclusion Catastrophic coverage (CAT): Special type ofYP, AYP Whole-Farm Revenue Protection: Insure Schedule F income
Types of Policies Yield Protection (YP) Individual Yield Insurance Revenue Protection (RP) and RP-HPE (harvest price exclusion) Individual Revenue Insurance Area Yield Protection (AYP) Area-wide (County) Yield Insurance Area Revenue Protection (ARP) and ARP-HPE (harvest price exclusion) Area-wide (County) Revenue Insurance
Farmer Choices After farmer chooses a policy (YP, RP, AYP, ARP), then they have three choices to make Coverage Level (like the deductible) Price Election (payment rate for losses) Unit Structure (some policies have no options) Explain Yield Protection details to understand the other policies The oldest and original policy that others are based on
YP: Yield Protection If actual harvested yield is less than your Yield Guarantee, you receive an indemnity Actual Production History (APH): Average harvested yields over last 4-10 years Yield Guarantee: chose Coverage Level as % of your APH (Actual Production History) Coverage Level: % average yield (APH) chosen as guarantee, from 50% to 85% by 5% intervals Price Election: Choose price paid for each bushel below your yield guarantee, from 100% to 55% of established Base Price
Coverage Level sets Yield Guarantee: Example to Illustrate Coverage Level Yield Guarantee 50% x 155 = 78 bu/ac 55% x 155 = 85 bu/ac 60% x 155 = 93 bu/ac 65% x 155 = 101 bu/ac 70% x 155 = 109 bu/ac 75% x 155 = 116 bu/ac 80% x 155 = 124 bu/ac 85% x 155 = 132 bu/ac Year Yield 2016 165 2017 175 2018 150 2019 110 2020 145 2021 185 AVG 155 APH = 155
Price Election How much you are paid for each bushel that actual harvested yield is below yield guarantee Base Price set by USDA-RMA: Average of Dec corn (Nov soybean) futures contracts on Chicago Mercantile in Feb Choose 100% to 60% of this price in 1% intervals, appears as $/bu options Almost all farmers choose 100% 2016: Corn $3.86, Soybeans $8.85, Wheat $5.13 2017: Corn $3.96, Soybeans $10.19, Wheat $4.74 2018: Corn $3.96, Soybeans $10.16, Wheat $5.02 2019: Corn $4.00, Soybeans $9.54, Wheat $4.35 2020: Corn $3.88, Soybeans $9.17, Wheat $4.94 2021: Corn $4.58, Soybeans $11.87, Wheat $4.90 2022: Corn $5.90, Soybeans $14.33, Wheat $7.08
YP Indemnity If Actual Harvested Yield < Yield Guarantee Indemnity = Price x (Yguarantee Yharvested) Price: Chosen Price Election: Most farmers choose 100% Coverage Level determines your trigger, pay more for higher coverage levels (lower deductible) Price Election determines how much you are paid when you have a loss, pay more for higher price election
Unit Structure Legally define the area (fields) insured Can t just combine fields any way you want: Rules to follow Planted to the same crop during the insurance period Cannot cut across a county line Must have separate production records for each unit Three types of units (smallest to largest) Optional Unit, Basic Unit, Enterprise Unit All insurance guarantees work at the unit level, not on a per acre basis Example: 100 acre unit, average yield 160 bu/ac, 75% coverage level = 100 x 160 x 0.75 = 12,000 bushels Guaranteed 12,000 bu from those 100 acres
Unit Structure Choices Smaller units means more indemnities (averaging over smaller area) and so larger premiums Government encourages larger units by giving larger premium subsidies for larger units (enterprise unit discount) Current Recommendation: Choose Enterprise Units if you qualify because of the large premium discount Otherwise choose Optional Units Enterprise Unit: need two units, with the smallest > 20 acres or 20% insured acres, or 660 total acres in one unit Lots of rules: Crop insurance agent can help you figure out rules
Farms A-G: Same operator planting the same crop Basic Units 1) A, C, D, and F Farm B 50-50 crop share lease from Smith Farm D cash rent from Jones Farm A Owned 2) B and E 3) G Farm E 50-50 crop share lease from Smith Township Section 2 Township Section 1 Farm C cash rent from Smith Optional Units 1) A and C 2) B Farm G 60-40 crop share lease from Black Farm F Owned 3) D 4) E 5) F 6) G Township Section 11 Township Section 12 Enterprise Unit 1) A thru G
Simple YP Example for a Unit Suppose have one unit, 100 acres of corn APH (average yield) is 160 bu/ac Choose 70% coverage level, and 100% price election $5.65/bu Yield guarantee = 70% x 160 bu/ac = 112 bu/ac Unit Guarantee = 112 x 100 ac = 11,200 bushels Actual harvest from Unit is 10,500 bu (or 105 bu/ac) Indemnity: $5.65 x (11,200 10,500) = $3,955 (or $39.55/ac) Notice how guarantee and indemnity work at the unit level However, farmer and others often talk about it at the per acre level
Revenue Protection Combines Yield Protection with price protection based on CBOT futures prices Your yield history and the CBOT prices set your preliminary Revenue Guarantee Same coverage levels, same unit structures as YP Your actual revenue at harvest is your yield x final CBOT price (Nov average of Dec corn or Oct average of Nov soybean contract) If your actual harvested revenue is below your guarantee, triggers an indemnity payment
Initial and Final Revenue Guarantee: RP vs. RP-HPE Base Price: Feb avg of Dec corn futures Harvest Price: Nov avg of Dec corn futures Initial Revenue Guarantee: calculated using the Base Price Final Revenue Guarantee: calculated using the maximum of Base Price and Harvest Price With RP, if price increases over season, your revenue guarantee increases, if price falls, your guarantee remains unchanged RP-Harvest Price Exclusion: revenue guarantee is not updated with the maximum of the Base price and the Harvest price Lower indemnities with RP-HPE if price increases and have low yield, so Lower Premiums Very few farmers buy RP-HPE
RP Protects Against Both Price Increases & Decreases If the price falls or you have a low yield, you know you will have the grain, or the money to buy grain at harvest time prices, to fulfill contracts or feed livestock If the price increases, your revenue guarantee increases too, so again you know you will have the grain, or the money to buy the grain at existing prices, to fulfill contracts or feed livestock Payments base on CBOT prices, you still have to market your grain Can now market more aggressively since you will have grain or indemnities to buy grain at existing harvest time market prices if you have a yield loss
22 Years of data on (Final Price Base Price) Average: Corn -4 , Soybean +4 , Wheat +8 $4.00 $3.00 $2.00 $1.00 $0.00 ($1.00) ($2.00) ($3.00) Corn Soybeans Wheat ($4.00) ($5.00)
Simple Example Comparing the YP, RP, RP-HPE Assume 150 bu/ac APH and 70% coverage level, so YP: per acre guarantee is 105 bu/ac Base price $5.00, so RP and RP-HPE Initial Guarantee $5.00 x 105 = $525/ac Actual yield is 75 bu/ac, so loss is 105 75 = 30 bu/ac YP pays $5.00 x 30 bu/ac = $150/ac What happens if harvest price increased to $6.00? RP Guarantee $6.00 x 10⁵ bu/ac = $630/ac RP pays: $630 ($6.00 x 75) = $630 $450 = $180/ac RP-HPE: Guarantee not change: $525 $450 = $75/ac What happens if harvest price decreased to $4.00? RP and RP-HRE Guarantees do not change Both pay $525 ($4.00 x 75) = $525 $300 = $225/ac Note: all of these would be at unit level, not per acre
RP vs. RP-HPE vs. YP (150 bu/ac APH & 70% coverage level) Base Price $/bu Guarantee $/ac bu/ac $525 Harvest Price $/bu Guarantee $/ac bu/ac Actual Yield bu/ac Policy Actual Indemnity $/ac 630 450 = $180 525 450 = $75 Revenue $/ac $450 RP $5.00 $6.00 $630 75 RP-HPE $5.00 $525 $6.00 $525 75 $450 YP $5.00 105 bu/ac $6.00 105 bu/ac 75 $450 $5 x (105 75) = $150 525 300 = $225 525 300 = $225 RP $5.00 $525 $4.00 $525 75 $300 RP-HPE $5.00 $525 $4.00 $525 75 $300 YP $5.00 105 bu/ac $4.00 105 bu/ac 75 $300 $5 x (105 75) = $150
RP vs. RP-HPE vs. YP If price decreases during the season (harvest price < base price), no difference between RP and RP-HPE If price increases during the season (harvest price > base price) and low yield occurs, larger indemnity for RP than for RP-HPE RP preserves opportunity for upside gains, but RP-HPE does not RP more costly than RP-HPE for this reason Note: RP-HPE: can do worse than YP if high prices and low yields RP-HPE uses actual higher harvest price to calculate actual revenue, while YP uses actual yield loss at lower base price RP-HPE: worst if low yields and high prices, best if low yields and low prices: How likely are these in the Midwest? [see map later]
Simple RP Example for a Unit Suppose have one unit, 100 acres of corn APH (average yield) is 160 bu/ac Announced Base Price is $3.75 Choose 70% coverage level Initial Revenue Guarantee = 70% x 160 bu/ac x $3.75/bu x 100 ac = $42,000 Harvest time price announced as $4.00/bu Final Revenue Guarantee = 70% x 160 bu/ac x $4.00/bu x 100 ac = $44,800 Actual harvest from Unit is 10,500 bu (or 105 bu/ac), so actual revenue from Unit = $4.00 x 10,500 = $42,000 Indemnity: $44,800 $42,000 = $2,800 (or $28/ac) Again, guarantee and indemnity work at the unit level, but farmers and others often talk about it at the per acre level
AYP Area Yield Protection ARP Area Revenue Protection AYP is same as YP, except that it uses USDA-NASS county average yield (not your yield) ARP is the same as RP except that it uses USDA-NASS county average yield ARP-HPE is the same as RP-HPE except uses USDA- NASS county average yield Payments not made until Mar/Apr when USDA-NASS publishes yields, while RP and YP are paid sooner Can create cash flow issues
WI Crop Insurance Policies: Corn & Soybeans Individual (Farm) Area-Wide (County) So Many Options!! YP AYP Yield Yield Protection RP Revenue Protection Area Yield Protection ARP Area Revenue Protection Revenue RP-HPE: Harvest Price Exclusion ARP-HPE w/ Harvest Price Exclusion Catastrophic coverage (CAT): Special type ofYP, AYP Whole-Farm Revenue Protection: Insure Schedule F income
% of Insured Corn and Soybean Acres by Policy Type in Wisconsin in 2021 100% Corn Soybean 90% % of Insured Acres for Crop 80% Corn 91.6% 7.1% 98.7% Soybean 95.1% 4.6% 99.7% 70% RP YP sum 60% 50% 40% 30% 20% 10% 0% RP YP ARP AYP
RP (Harvest Price Option) on Corn, 2017 Farmers not using RP with Harvest Price Option are using RP-HPE Farmers use RP- HPE if local prices are less tied to CBOT prices, so outside of Midwest Remember: RP- HPE: worst if low yields & high prices, best if low yields & low prices https://farmdocdaily.illinois.edu/2018/05/overwhelming-use-of-harvest-price-option.html
Coverage Levels used by WI farmers for RP and YP in 2019 for Corn and Soybeans Coverage Level 50% 55% 60% 65% 70% 75% 80% 85% Corn RP Soy RP Corn YP 1% 1% 0% 0% 1% 1% 3% 3% 15% 15% 44% 42% 30% 31% 5% 6% Soy YP 45% 1% 8% 10% 21% 11% 3% 0% 51% 1% 4% 7% 18% 15% 3% 0%
Coverage Levels used by WI farmers for RP and YP in 2019 for Corn and Soybeans Coverage Level 50% 55% 60% 65% 70% 75% 80% 85% Corn RP Soy RP Corn YP 1% 1% 0% 0% 1% 1% 3% 3% 15% 15% 44% 42% 30% 31% 5% 6% Soy YP 45% 1% 8% 10% 21% 11% 3% 0% 51% 1% 4% 7% 18% 15% 3% 0% 65%-70% of all corn & soybean acres planted in WI use RP with a 70% to 80% coverage level 89% of RP 88% of RP
Average Number of Units per Policy in WI Year CORN RP SOY RP CORN YP SOY YP 2011 2012 2013 2014 2015 2016 2017 2018 2019 1.98 1.78 1.71 1.67 1.60 1.56 1.51 1.48 1.49 1.73 1.58 1.53 1.51 1.50 1.48 1.47 1.44 1.40 1.84 1.80 1.78 1.74 1.67 1.64 1.57 1.55 1.56 1.57 1.54 1.49 1.38 1.39 1.43 1.31 1.41 1.32 More and more WI farmers are using Enterprise Units
Supplemental Coverage Option (SCO) SCO: allows you to insure part of your RP/YP deductible with a county policy (ARP/AYP) Layer individual & county coverage Can t exceed 86% total coverage Add SCO to your RP policy to increase coverage up to the 86% of your expected revenue SCO will not pay until county loss exceeds 14% 65% SCO premium subsidy (farmer pays 35% of premium) SCO available, but only if you choose PLC If choose ARC, cannot buy SCO
Possible outcomes with RP plus SCO 1. SCO pays, but not RP (low county yield, good farm yield) 2. RP pays, but not SCO (good county yield, low farm yield) 3. Both SCO and RP pay (low prices, low county and low farm yield) 4. Neither SCO nor RP pays (high prices, good county and good farm yield)
Supplemental Coverage Option (SCO) Example Suppose you have 75% RP on corn (25% deductible) Suppose you added 86% SCO (max you can buy): would be ARP Suppose county revenue is 80% of the guarantee Suppose your revenue is 65% of your guarantee Outcome 3 occurs: both RP and SCO pay Receive SCO indemnity for a 6% revenue loss Receive RP indemnity for a 10% revenue loss
Enhanced Coverage Option (ECO) ECO: Insure part of your RP/YP deductible with a county policy (ARP/AYP) Covers from 86% up to 95% of expected revenue based on county revenue Can use ECO whether sign up for ARC or PLC Can add ECO on top of SCO or use ECO instead of SCO ECO has smaller premium subsidy https://farmdocdaily.illinois.edu/2020/11/the-new-enhanced-coverage- option-eco-crop-insurance-program.html
Farmer Use of SCO and ECO in Wisconsin Year Crop Corn Soybeans Wheat Corn Soybeans Wheat Corn Soybeans Wheat SCO Policies 827 310 11 848 476 68 697 497 64 SCO Acres 268,490 77,653 ECO Policies ECO Acres 2020 700 255,037 107,021 6,708 225,266 110,593 6,106 718 467 228,017 104,107 2021 774 239,718 2022 4 568 5,340 56
Lots of Crop Insurance Rules There are lots and lots of crop insurance rules not covered here Planting date requirements, Late and prevented planting coverage, Double cropping and cover cropping rules, Alternative crop uses, Corn maturity limits, Yield guarantee calculations, Unit structure rules, Crop quality losses, Breaking new ground (CRP vs pasture) You can forfeit your coverage if you break a rule, so know the rules, always communicate with your agent Insurance agents don t always know all the rules, but good agents do Agents all sell exactly the same polices for exactly the same prices, you are buying service Find someone you like to work with There are ways to get the most out of your policy, to use the rules to your advantage, good agents know how
Margin Protection for Corn and Soybeans in WI Protects the margin between expected revenue and expected operating costs in the area Available for Corn, Soybeans, Wheat and Rice WI: only corn and soybeans: See map: blue is corn and soybeans, pink is soybeans only, yellow is corn only Crop prices like RP, based on CBOT Inputs costs based on fuel, fertilizer, interest rate with futures markets Corn Inputs: Diesel, Urea, Diammonium phosphate price, Potash, Interest Soybean Inputs: Diesel, Diammonium phosphate price, Potash, Interest Sold 34 corn and 59 soybean policies in 2021, ~10,000 acres covered
Crop Insurance for Other Crops Almost all major WI crops have a standard crop insurance policy for them, usually only YP Corn silage is a type of corn (RP, YP, ARP, AYP) Small Grains: Wheat, Oats, Rye (RP, YP). barley, sorghum (YP only) Vegetables: Potatoes, sweet corn, snap beans, green peas, cabbage, cucumbers, dry beans Miscellaneous: Cranberries, hybrid seed corn, apples, tart cherries Forage production and seeding (999 & 1,367 WI policies in 2021) Pasture Rangeland Forage (PRF): insure weather station precipitation and temperature ranges, for forage production (335 WI policies in 2021)
Other Alternative Crop Insurance Policies Whole Farm Revenue Protection (WFRP): Insure Schedule F income, for farms with specialty crops, livestock, organic growers (10 WI policies in 2021) Alternatives if no policy exists USDA-FSA non-insured crop assistance program (NAP policy) Written Agreement: apply RMA policy from a similar area to your crop (e.g., grapes in WI based on MI policy) Organic prices now available for many crops Livestock price (not production) policies Livestock Gross Margin (LGM): LGM Dairy was somewhat popular, but has DMC killed it? Dairy Revenue Protection (Dairy RP): new in 2018
Dairy Revenue Protection (Dairy RP) Area-wide revenue protection against declines in quarterly revenue from milk sales: Not dairy margin like LGM Dairy (and DMC), kind of like ARP for dairy Uses futures prices and production data to create revenue guarantee, with payments triggered when actual market prices fall below the guarantee Milk Prices: USDA-AMS monthly average Milk Production: USDA-NASS Milk Production Report 2 pricing options: mix of class III/IV or component prices (fat, protein, other solids), you choose price weights Can cover up to 5 quarters into the future, depending on futures price data
Farmer chooses 1. Price Election (% s) 2. Milk Covered 3. Coverage Level Used to set guarantee I do not understand State- Indexed Actual Production and options for farmer s choice of Milk Covered Sales in 2019 US: 2,500 policies, 30 B lbs WI: 800 policies, 5 B lbs Average cows/policy US ~ 480, WI ~250
Government Role in Crop Insurance Administered by USDA-Risk Management Agency (RMA) and Federal Crop Insurance Corporation (FCIC) USDA develops policies, rules, and premium rates Development & administration costs paid by the public USDA pays subsidy to companies for Administration and Operating (A&O) ~20-25% of total premiums FCIC reinsures the insurance companies (insures the insurance companies), plus retains some of the policies (pays some of the indemnities)
Government Role in Crop Insurance Private companies sell insurance policies, but the government regulates the market All companies sell exactly the same policies at the same prices set by the government USDA subsidizes the premiums Farmers pay about of the actuarially fair premiums on average, the USDA subsidizes the rest If on average, $100 indemnity paid once every 4 years, then actuarially fair premium is $25 These premium subsidies mean that on average, farmers should make money from crop insurance


")

")


 on Corn, 2017")


")

 Example")
")


")