Soil Health Survey Overview in Hickman, Broken Bow, and Mead
The Soil Health Survey Overview in Hickman, Broken Bow, and Mead reveals insights into the occupation distribution, utilization of livestock, cover crop practices, obstacles to cover crop use, and incentives driving changes to improve soil health in these regions. Farmers, landowners, and consultants play key roles in managing crop acres and advising on agricultural practices to enhance soil health. Factors influencing cover crop adoption and incentives for soil health improvement are also highlighted.
- Soil Health Survey
- Occupation Distribution
- Livestock Utilization
- Cover Crop Practices
- Soil Health Incentives
Download Presentation

Please find below an Image/Link to download the presentation.
The content on the website is provided AS IS for your information and personal use only. It may not be sold, licensed, or shared on other websites without obtaining consent from the author. Download presentation by click this link. If you encounter any issues during the download, it is possible that the publisher has removed the file from their server.
E N D
Presentation Transcript
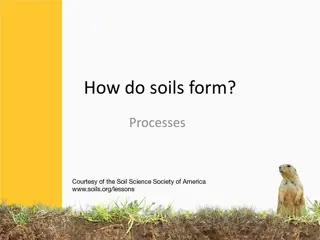
Soil Health Survey Overview Hickman, Broken Bow, and Mead
Occupation Farmer/Producer Landowner (Not a Farmer) Crop Consultant/Adviser NRCS/UNL/Government Other Hickman (n=70) 79% 9% 7% 3% 3% Broken Bow (n=14) Mead (n=43) 71% 0% 0% 21% 7% 58% 7% 19% 9% 7% Number of crop acres that you directly manage or influence-- PRODUCERS ONLY zero acres 1 - 199 acres 200 - 999 acres 1000 - 3,999 acres 4,000 & greater total crop acres Hickman (n=69) Broken Bow (n=13) Mead (n=37) 4% 14% 32% 41% 9% 23% 15% 15% 31% 15% 14% 24% 27% 19% 16% List the number of total acres that you advise."--- ADVISOR ONLY zero acres 1 - 9,999 crop acres 10,000 - 99,999 crop acres 100,000 - 999,999 total crop acres 1,000,000 total crop acres or more Hickman (n=30) 27% 60% 13% 0% 0% Broken Bow (n=8) 38% 50% 13% 0% 0% Mead (n=22) 14% 36% 32% 14% 5%
Hickman Broken Bow Mead Utilize livestock in their operation 59% (n=70) 83% (n=13) 45% (n=40) Avg. Per Advisor (n=18) 950 Avg. per producer (n=58) 209 Avg. Per Advisor (n=29) 1333 Avg. per producer (n=29) 231 Avg. Per Advisor (n=5) 750 Total acres that you advise that are seeding cover crops for soil health and/or livestock-- ADVISOR ONLY Avg. per producer (n=11) 54 The number of cover crop acres that I routinely plant is ____? -- PRODUCER ONLY
As a Tenant or Landowner, rate the most pressing obstacles to increase cover crop use in your farming operation? (1 = no obstacle and 5 = major obstacle) | Hickman (n=69), Broken Bow (n=13), Mead (n=41) 4.5 4 3.5 3 2.5 2 1.5 1 0.5 0 1. Input costs including seed cost 2. Weather issues 3. Farm machinery and equipment 4. Farm labor 5. Potential of a crop yield lag 6. The window and later crop harvest 7. Allowing livestock to graze cover crops 8. Termination of cover crop issues 9. Pest issues 10. It limits my herbicide options Hickman Broken Bow Mead
What incentives most drive you in making changes to improve soil health? (1: No value as incentive; 5 : High value as incentive) | Hickman (n=69), Broken Bow (n=13), Mead (n=41) 6 5 4 3 2 1 0 1. If the change makes my operation more dollars 2. I want to leave my land better for the next generation 3. Improve my soil organic matter and soil carbon 4. Because my landlord wants me to 5. Discounted crop insurance rates 6. Improve my crop yields 7. Increase the value of my land for a future sale 8. Increase my soil water infiltration 9. Decrease nitrogen leaching into groundwater 10. Decrease topsoil erosion 11. Decrease pesticide and nutrient loss in water runoff from my fields 12. Decrease weather risk and increase weather resiliency of my crops 13. Increase weed control 14. Reduce herbicide use Hickman Broken Bow Mead
What present factors most impact the rates of Nitrogen, P & K that you apply and/or manage? (1 = no impact to 5 = most impact) | Hickman (n=69), Broken Bow (n=13), Mead (n=41) 5 4.5 4 3.5 3 2.5 2 1.5 1 0.5 0 1. The cost of the fertilizer 2. Improved crop genetics 3. I use tissue tests or other tests to sidedress 4. I adjust my N rate as based on my soil tests 5. Past experience plus advice from my agronomy "team" 6. Government mandates require reduced rates 7. I use "in season" climate models to base my nutrient rates 8. I prefer to fertigate or chemigate with nitrogen, "inseason" vs. applying all "N" in the fall or spring. 9. I reduce my N rate based on the previous legume crop (soybeans, alfalfa) or manure and/or Irrigation water usage and/or crop hybrids Hickman Broken Bow Mead
