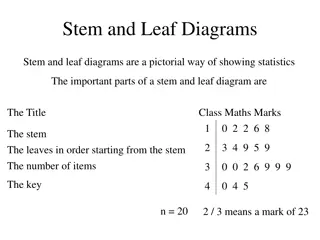
Understanding Stem-and-Leaf Displays in Data Analysis

Stem-and-Leaf
Displays
Stem-and-Leaf Display
•
In this section, we will introduce stem-and-leaf displays.
•
A stem-and-leaf display is a method that is used to rank-order
and arrange data into groups.
•
Frequency distributions and histograms provide a useful
organization and summary of data. However, in a histogram,
we lose most of the specific data values.
•
Stem-and-leaf displays are another way to represent
quantitative
data
. They give more detail because they show the
actual data. A stem-and-leaf display allows us to
recover the
original data if desired
.
Stem-and-Leaf Display
•
In a stem-and-leaf plot each data value is split into a "
stem
"
•
and a "
leaf
".
The "
leaf
" is usually the last digit of the number
•
and the other digits to the left of the "leaf" form the "
stem
".
•
To show a
one-digit number
(such as 9) using a stem-and-
•
leaf plot, use a stem of 0 and a leaf of 9.
•
To show a
two-digit number
(such as 25), the stem is 2 and
the leaf is the 5.
•
If the observed value is a
three-digit number
(such as 369),
the stem is 36 and the leaf is 9.
•
If the observations are accurate to one or more decimal places,
such as 23.7, the stem is 23 and the leaf is 7.
Stem-and-Leaf Display
HOW
TO MAKE A STEM-AND-LEAF DISPLAY
1.
Divide the digits of each data value into two parts. The
"
leaf
" is usually the last digit of the number and the other
digits to the left of the "leaf" form the "
stem
".
2.
Align all the stems in a vertical column from smallest to
largest. Draw a vertical line to the right of all the stems.
3.
Place all the leaves with the same stem in the same row as
the stem, and arrange the leaves in increasing order.
4.
Use a label to indicate the magnitude of the numbers in the
display. We include the decimal position in the label rather
than with the stems or leaves.
Example –
Stem
-
and
-
Leaf Display
•
In this example, we will make a stem-and-leaf display.
•
Many airline passengers seem weighted down by their
carry-on luggage. Just how much weight are they
carrying?
•
The carry-on luggage weights in pounds for a random
sample of 40 passengers returning from a vacation to
Hawaii were recorded (see Table below).
Weights of Carry-On Luggage in Pounds
Table 2-15
Example –
Stem-and-Leaf Display
•
To make a stem-and-leaf display, we divide each data
value into
two
parts.
•
The weights in our example consist of two-digit
numbers. For a two-digit number, the stem selection is
obviously the left digit. In our case, the digit in the tens
place
will form the
stems
, and the
digit in the units
place
will form the
leaf
.
•
For example, for the weight 12, the stem is 1 and the
leaf is 2.
Since the data range from 0 to 51, the stems
range from 0 to 5.
cont’d
Example –
Stem-and-Leaf Display
•
In the stem-and-leaf display, we list each possible stem once
on the left and all its leaves in the same row on the right, as in
Figure 2-15(a). Then we order the leaves as shown in Figure 2-
15(b).
Figure 2-15
Stem-and-Leaf Displays of Airline Carry-On Luggage Weights
(a) Leaves Not Ordered
(b) Final Display with Leaves Ordered
cont’d
Note: Do not separate the leaves by commas.
Example –
Stem-and-Leaf Display
•
A good Stem-and-Leaf Display shows how the data are spread -- that is,
highest number, lowest number, most common number and outliers (a number
that lies outside the main group of numbers).
•
It is important to note that when there is a repeated number in the data (such
as two 12s) then the plot must reflect such (so the plot would look like 1 | 2 2).
•
We see that most of the weights were in the 30-lb range, only two were less
than 10 lb, and six were over 40 lb.
•
As a final step, we need to
indicate the scale
. This is usually done by
indicating the value represented by the stem and one leaf.
cont’d
Figure 2-15
(b)
•
Stem-and-leaf displays show each of the original data values.
It's interesting that this plot looks very similar to a histogram,
only it gives us the actual data. By looking at the display
“
sideways
,” you can see the distribution shape of the data.
Example –
Stem-and-Leaf Display
Look at the distribution in this example:
we say that the distribution is kind of
skewed to the left.
S
t
e
m
-
a
n
d
-
L
e
a
f
D
i
s
p
l
a
y
There are some limitations to stem-and-leaf displays.
In particular, we're limited to small data sets - can you
imagine the leaves if we had 1,000 test scores?
Also, the range in the data needs to be fairly small.
Graphing Utilities TI 83/84
TI-83/84 Plus does not support stem-and-leaf display.
However, you can sort the data by using a calculator.
Let’s begin by performing an ascending(from smallest to largest)
sort. Press
STAT
–
ENTER
. Enter the data set into one list, say
L1. Then press
STAT
.
Press the down arrow once to select the
SortA(
command.
Press
ENTER
to paste this command to
the home screen.
Graphing Utilities TI 83/84
Next we must indicate the list to be sorted. We wish to sort our
data set, entered as L1. Press
2
nd
1
. Press
ENTER
once more to
execute the sort. The calculator responds with
Done
when it is
finished.
Now, we may view the sorted data.
Press
STAT.
Press
ENTER
for the Edit window. Now simply
use the up/down arrow keys to scroll through the data.
(Note: To sort the data in descending order (from largest to
smallest), use the
3: SortD
command.)
P
r
a
c
t
i
c
e
p
r
o
b
l
e
m
#
1
:
One sportswriter listed the winning scores of the conference
championship games over the last 35 years. The scores for
those games follow below.
132 118 124 109 104 101 125 83 99 131
98 125 97 106 112 92 120 103 111 117
135 143 112 112 116 106 117 119 110 105
128 112 126 105 102
i) Make a Stem-and-leaf display.
ii) Looking at the distribution, would you say that it is fairly
symmetrical?
P
r
a
c
t
i
c
e
p
r
o
b
l
e
m
#
1
:
i) Make a Stem-and-leaf display.
1). We break the digits of each data value into
two
parts. Use the
leftmost two digits as
stem
,
and the single rightmost digit
as
leaf
.
2). Since the data range from 83 to 181,
the stems range from 8 to 18.
Align all the stems in a vertical column
from smallest to largest.
Draw a vertical line to the right of all
the stems. Write each leaf in the row to
the right of its stem.
3). Rearrange the leaves in increasing order. And indicate the scale.
P
r
a
c
t
i
c
e
p
r
o
b
l
e
m
#
1
:
ii) Looking at the distribution, would you say that it is fairly
symmetrical?
Yes. Notice that stem 11 has the most data.
P
r
a
c
t
i
c
e
p
r
o
b
l
e
m
#
2
:
The weights (to the nearest tenth of a kilogram) of 30 students
were measured and recorded as follows:
59.2 61.5 62.3 61.4 60.9 59.8 60.5 59.0 61.1 60.7 61.6
56.3 61.9 60.4 62.2 58.9 59.0 61.2 62.1 61.4 58.4 60.8
60.2 62.7 60.0 59.3 61.9 61.7 58.4 59.9
Draw a stem-and-leaf display for the data. Briefly comment
on what the analysis shows.
In this case, the stems will be the whole number values and
the leaves will be the decimal values.
The data range from 56.3 to 62.7, so the stems should start
at 56 and finish at 62.
P
r
a
c
t
i
c
e
p
r
o
b
l
e
m
#
2
:
Weights of 30 students
We say that the distribution is skewed to the left.
This stem and
leaf display reveals that the group with the highest number of
observations recorded is the 61.0 to 61.9 group.
Note: leave this one blank
Stem-and-leaf displays offer a detailed way to represent quantitative data by organizing data into stems and leaves. This method allows for the recovery of original data values, providing more specific insights compared to histograms. Learn how to create stem-and-leaf displays and apply them in data analysis scenarios.

Download Presentation

Please find below an Image/Link to download the presentation.
The content on the website is provided AS IS for your information and personal use only. It may not be sold, licensed, or shared on other websites without obtaining consent from the author. Download presentation by click this link. If you encounter any issues during the download, it is possible that the publisher has removed the file from their server.
E N D
Presentation Transcript
Stem-and-Leaf Displays
Stem-and-Leaf Display In this section, we will introduce stem-and-leaf displays. A stem-and-leaf display is a method that is used to rank-order and arrange data into groups. Frequency distributions and histograms provide a useful organization and summary of data. However, in a histogram, we lose most of the specific data values. Stem-and-leaf displays are another way to represent quantitative data. They give more detail because they show the actual data. A stem-and-leaf display allows us to recover the original data if desired.
Stem-and-Leaf Display In a stem-and-leaf plot each data value is split into a "stem" and a "leaf". The "leaf" is usually the last digit of the number and the other digits to the left of the "leaf" form the "stem". To show a one-digit number (such as 9) using a stem-and- leaf plot, use a stem of 0 and a leaf of 9. To show a two-digit number (such as 25), the stem is 2 and the leaf is the 5. If the observed value is a three-digit number (such as 369), the stem is 36 and the leaf is 9. If the observations are accurate to one or more decimal places, such as 23.7, the stem is 23 and the leaf is 7.
Stem-and-Leaf Display HOW TO MAKE A STEM-AND-LEAF DISPLAY 1. Divide the digits of each data value into two parts. The "leaf" is usually the last digit of the number and the other digits to the left of the "leaf" form the "stem". 2. Align all the stems in a vertical column from smallest to largest. Draw a vertical line to the right of all the stems. 3. Place all the leaves with the same stem in the same row as the stem, and arrange the leaves in increasing order. 4. Use a label to indicate the magnitude of the numbers in the display. We include the decimal position in the label rather than with the stems or leaves.
Example Stem-and-Leaf Display In this example, we will make a stem-and-leaf display. Many airline passengers seem weighted down by their carry-on luggage. Just how much weight are they carrying? The carry-on luggage weights in pounds for a random sample of 40 passengers returning from a vacation to Hawaii were recorded (see Table below). Weights of Carry-On Luggage in Pounds Table 2-15
Example Stem-and-Leaf Display To make a stem-and-leaf display, we divide each data value into two parts. cont d The weights in our example consist of two-digit numbers. For a two-digit number, the stem selection is obviously the left digit. In our case, the digit in the tens placewill form the stems, and the digit in the units place will form the leaf. For example, for the weight 12, the stem is 1 and the leaf is 2. Since the data range from 0 to 51, the stems range from 0 to 5.
Example Stem-and-Leaf Display In the stem-and-leaf display, we list each possible stem once on the left and all its leaves in the same row on the right, as in Figure 2-15(a). Then we order the leaves as shown in Figure 2- 15(b). cont d Note: Do not separate the leaves by commas. (a) Leaves Not Ordered (b) Final Display with Leaves Ordered Stem-and-Leaf Displays of Airline Carry-On Luggage Weights Figure 2-15
Example Stem-and-Leaf Display A good Stem-and-Leaf Display shows how the data are spread -- that is, highest number, lowest number, most common number and outliers (a number that lies outside the main group of numbers). It is important to note that when there is a repeated number in the data (such as two 12s) then the plot must reflect such (so the plot would look like 1 | 2 2). cont d We see that most of the weights were in the 30-lb range, only two were less than 10 lb, and six were over 40 lb. As a final step, we need to indicate the scale. This is usually done by indicating the value represented by the stem and one leaf. Figure 2-15 (b)
Example Stem-and-Leaf Display Stem-and-leaf displays show each of the original data values. It's interesting that this plot looks very similar to a histogram, only it gives us the actual data. By looking at the display sideways, you can see the distribution shape of the data. Look at the distribution in this example: we say that the distribution is kind of skewed to the left.
Stem Stem- -and and- -Leaf Display Leaf Display There are some limitations to stem-and-leaf displays. In particular, we're limited to small data sets - can you imagine the leaves if we had 1,000 test scores? Also, the range in the data needs to be fairly small.
Graphing Utilities TI 83/84 TI-83/84 Plus does not support stem-and-leaf display. However, you can sort the data by using a calculator. Let s begin by performing an ascending(from smallest to largest) sort. Press STAT ENTER. Enter the data set into one list, say L1. Then press STAT.Press the down arrow once to select the SortA( command. Press ENTER to paste this command to the home screen.
Graphing Utilities TI 83/84 Next we must indicate the list to be sorted. We wish to sort our data set, entered as L1. Press 2nd 1. Press ENTER once more to execute the sort. The calculator responds with Done when it is finished. Now, we may view the sorted data. Press STAT. Press ENTER for the Edit window. Now simply use the up/down arrow keys to scroll through the data. (Note: To sort the data in descending order (from largest to smallest), use the 3: SortD command.)
Practice problem #1: Practice problem #1: One sportswriter listed the winning scores of the conference championship games over the last 35 years. The scores for those games follow below. 132 118 124 109 104 101 125 83 99 131 98 125 97 106 112 92 120 103 111 117 135 143 112 112 116 106 117 119 110 105 128 112 126 105 102 i) Make a Stem-and-leaf display. ii) Looking at the distribution, would you say that it is fairly symmetrical?
Practice problem #1: Practice problem #1: i) Make a Stem-and-leaf display. 1). We break the digits of each data value into two parts. Use the leftmost two digits as stem,and the single rightmost digit as leaf. 2). Since the data range from 83 to 181, the stems range from 8 to 18. Align all the stems in a vertical column from smallest to largest. Draw a vertical line to the right of all the stems. Write each leaf in the row to the right of its stem.
Practice problem #1: Practice problem #1: 3). Rearrange the leaves in increasing order. And indicate the scale. ii) Looking at the distribution, would you say that it is fairly symmetrical? Yes. Notice that stem 11 has the most data.
Practice problem #2: Practice problem #2: The weights (to the nearest tenth of a kilogram) of 30 students were measured and recorded as follows: 59.2 61.5 62.3 61.4 60.9 59.8 60.5 59.0 61.1 60.7 61.6 56.3 61.9 60.4 62.2 58.9 59.0 61.2 62.1 61.4 58.4 60.8 60.2 62.7 60.0 59.3 61.9 61.7 58.4 59.9 Draw a stem-and-leaf display for the data. Briefly comment on what the analysis shows. In this case, the stems will be the whole number values and the leaves will be the decimal values. The data range from 56.3 to 62.7, so the stems should start at 56 and finish at 62.
Practice problem #2: Practice problem #2: Weights of 30 students Note: leave this one blank We say that the distribution is skewed to the left. This stem and leaf display reveals that the group with the highest number of observations recorded is the 61.0 to 61.9 group.