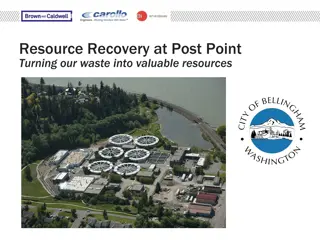
Biosolids Planning Core Team Meeting Summary - City of Bellingham, July 2017

City of Bellingham Biosolids Planning Core Team Meeting held on July 18, 2017, discussed various topics including site visit debrief, TBL+ scoring, project cost discussion, and next steps. The meeting agenda encompassed reviewing objectives, selecting conceptual alternatives, and assessing social, environmental, and technical factors. The team also reviewed biosolids programs in neighboring areas such as Tacoma, Sumner, Pierce County, and King County, along with changes in scoring factors since the last meeting.

Download Presentation

Please find below an Image/Link to download the presentation.
The content on the website is provided AS IS for your information and personal use only. It may not be sold, licensed, or shared on other websites without obtaining consent from the author. Download presentation by click this link. If you encounter any issues during the download, it is possible that the publisher has removed the file from their server.
E N D
Presentation Transcript
City of Bellingham Biosolids Planning Core Team Meeting July 18, 2017
Agenda Topic Topic Description Description Leader Leader Introduction (5 mins) Review agenda and meeting objectives Tadd Site Visit Debrief (15 mins) Discuss summary of takeaways and need for any additional visits Tadd TBL+ Scoring (90 minutes) Overview of TBL+ updates from last workshop Comparative Construction Costs Scoring of Financial Criteria Susanna Select Preferred Conceptual Alt (30 mins) Summary of scoring Project Phasing Class A vs. B Additional information/analysis needed? Tadd Project Cost Discussion (30 mins) Communication around the scale of the project Tadd Next Steps (20 mins) July 31 Public Workshop Council Briefing Phase 1 Tech Memo Tadd Brown and Caldwell 2
July 31 July 31 Brown and Caldwell 3
Site Visit Debrief Brown and Caldwell 4
Area Biosolids Programs Tacoma Treated as a business $$$ Rely on word of mouth (master gardeners) for marketing Sumner Free product No advertising Pierce County Class A high-quality product (pellet from dryer) currently being stored Alderwood Class A from belt dryer currently disposed at Boulder Park King County GroCo compost program (Class A) 95% Class B LOOP program Lynden/Arlington Class B with Compost for Class A use around town Brown and Caldwell 5
TBL+ Scoring Brown and Caldwell 6
Social, Environmental, and Technical Factor Scoring Changes Since last Core Team Meeting Environmental E1: Adjusted GHG reduction for all alternatives E3: Adjusted Alt 2 to 50% (2 of 4 resources recovered) E5: Adjusted Alt 4 to remove site remediation Social S3: Adjusted metric to public exposure of sensitive social areas (@ Post Point); comparison against current trips Technical T4: updated to include permitting quantity or duration, public acceptance, operations, biosolids market/distribution Brown and Caldwell 7
Review of Economic Factors in TBL+ F1: Optimizes system value F1: Optimizes system value. Provides balanced ROI using TBL+ criteria over 50 year life. F2: Affordability F2: Affordability. Consistent with long-term financial, environmental, and social goals of wastewater utility F3: Minimizes risk of end use market sensitivity F3: Minimizes risk of end use market sensitivity. Limits risk or maximizes benefits from commodity market changes of end use products. Brown and Caldwell 8
F1: Common Basis for Phase 1 Cost Estimating Comparative costs based planning level of design (1%-5%) AACE Cost Estimating Class 4 Typical range: -15% to +50% Construction costs include 40% contingency, escalation to mid- point (2023), 8.7% sales tax Project costs include 25% (eng/legal/admin) + land acquisition + 5% change order Common Elements Common Elements Capital costs Standby generator/ATS Maintenance building Influent screening upgrades Digester gas flares Cake loadout hopper O&M costs + Minor biosolids end use coordination + Digester labor - Incin O&M Brown and Caldwell 11
F1: Alt 1 Specific Costs Capital Costs O&M Costs Mesophilic digester, storage tank, gas cleaning Cogeneration/boiler Site remediation Miscellaneous site, piping, EI&C, general conditions, Contractor OH&P $66/hr trucking/tipping fee to eastern WA Truck loading operator coordination (30 min per truck) Cogeneration maintenance Power generation credit Polymer usage Brown and Caldwell 13
F1: Alt 2 Specific Costs Capital Costs O&M Costs Mesophilic digester, storage tank, gas cleaning Dryer and 4 days storage Site remediation Miscellaneous site, piping, EI&C, general conditions, Contractor OH&P Dryer operations 0.5 FTE $150/hr trucking/tipping fee within 100 miles to blending facility Dryer energy use Polymer usage 3 FTE for sale and admin Brown and Caldwell 15
F1: Alt 3 Specific Costs Capital Costs O&M Costs TPAD digesters and blending tanks, storage tank, gas cleaning Cogeneration/boiler Site remediation Miscellaneous site, piping, EI&C, general conditions, Contractor OH&P Land acquisition for blending facility Off-site blending facility with small admin bldg., maintenance shop, raw material storage, small rolling stock $150/hr trucking/tipping fee within 8 miles to City s blending facility Labor hours for TPAD digestion Production labor and diesel Cogeneration maintenance Power generation credit Polymer usage 3 FTE for sale and admin Brown and Caldwell 17
F1: Alt 4 Specific Costs Capital Costs O&M Costs Pump stations - energy and labor Labor hours for TPAD digestion Production labor and diesel Cogeneration maintenance Power generation credit Polymer usage 3 FTE for sale and admin On-site pump station 8 mile sludge pump forcemain and 4 mile centrate return pipe Land acquisition for solids and blending facility Off-site facilities TPAD digesters and blending tanks, storage tank, gas cleaning Cogeneration/boiler Centrate return pump station Solids treatment building with relocated GBTs and centrifuges and odor control Off-site miscellaneous site, piping, EI&C, general conditions, Contractor OH&P Off-site blending facility with raw material storage, small rolling stock 2,500 sf admin building; 2,500 sf maintenance building Brown and Caldwell 19
F1: Summary of Costs Alt 1 Alt 1 Alt 2 Alt 2 Alt 3 Alt 3 Alt 4 Alt 4 Capital (in 2023$) Construction Project $85 mil $111 mil $92 mil $119 mil $98 mil $129 mil $152 mil $198 mil Annual O&M $875k $1.4 mil $1.5 mil $1.4 mil 20-year NPW of Project Costs (in 2017$) $72.5 mil $83.5 mil $79.3 mil $116.6 mil Project Cost Project Cost r relative to highest score to highest score elative 100% 100% 85% 85% 91% 91% 39% 39% Comparative costs. Not for budgeting purposes. Brown and Caldwell 21
F2: Affordability ROM impact range estimate $2/month/$10M in capital $0.25/month/$100k of on-going O&M Alt 1 Alt 1 Alt 2 Alt 2 Alt 3 Alt 3 Alt 4 Alt 4 Capital (in 2023$) Construction Project $85 mil $111 mil $92 mil $119 mil $98 mil $129 mil $152 mil $198 mil Annual O&M $875k $1.4 mil $1.5 mil $1.4 mil Rate Range for Project Costs $24.40/mo $27.40/mo $29.50/mo $43.10/mo Project Project impact r relative to highest elative to highest score score impact 100% 100% 85% 85% 91% 91% 39% 39% Comparative costs in $2023. Not for budgeting purposes. Brown and Caldwell 23
F3: Minimizes risk of end use market sensitivity Revision to sensitivity of O&M costs to energy purchase price Energy purchase price is approximately 30% of annual O&M costs Alt 1 Alt 1 Alt 2 Alt 2 Alt 3 Alt 3 Alt 4 Alt 4 Net energy credit is approximately 20% of annual O&M costs with cogeneration Energy purchase price is approximately 30% of annual O&M costs Net energy credit is approximately 20% of annual O&M costs with cogeneration Net energy credit is approximately 20% of annual O&M costs with cogeneration Risk impact relative Risk impact relative to highest score to highest score 100% 100% 75% 75% 100% 100% 100% 100% Brown and Caldwell 24
Draft Scoring Summary with Financial criteria Alt Alt 1 1 Alt 2 Alt 2 Alt 3 Alt 3 Alt 4 Alt 4 F1: Optimizes system value 100% 86% 89% 35% F2: Affordability 100% 85% 91% 39% F3: Minimizes risk of end use market sensitivity 100% 75% 100% 100% Brown and Caldwell 25
Select Preferred Conceptual Alternative Brown and Caldwell 26
In a nutshell Alternative Alternative 1 1 Class B on Class B on- -site, land app app Alternative 2 Alternative 2 Class B and Class B and Dryer on Alternative 3 Alternative 3 Class A on Class A on- -site, Tagro Tagro off off- -site Alternative Alternative 4 4 Class A and Class A and Tagro site site site, land Dryer on- -site site site, site Tagro off off- - Environmental 21.1 10.5 All recovered energy is being used by the dryer (high GHG emissions) 25.0 Lowest GHG emissions and energy usage 22.1 Social 21.9 21.7 20.9 21.5 Economic 25.0 Least costly to only produce Class B 20.4 23.4 14.9 Significantly higher costs associated with a full solids plant off-site Technical/ Functional 20.8 No off-site implementation complexity 16.0 Uses the majority of the remaining footprint at Post Point 17.1 18.3 Saves space at Post Point for liquids upgrades/ Avoids potential future satellite WWTP Total Total 88.8 88.8 Lowest cost and Lowest cost and least complex to least complex to implement implement (no Class A available locally) A available locally) 68.9 68.9 Worst environmental, Worst environmental, limits future expansion at limits future expansion at Post Point Post Point 86.1 86.1 Best Best environmental environmental and and competitive in competitive in all other criteria. all other criteria. 76.2 76.2 Most expensive, but best Most expensive, but best option for regional and option for regional and preserving space at Post preserving space at Post Point Point (no Class Brown and Caldwell 27
If Class A desired by the community as a local option Alt 1A Class B on-site, Compost off-site Class A (land application backup) Brown and Caldwell 28
Phasing in a Local Product Brown and Caldwell 29
Phasing in a Local Product Brown and Caldwell 30
Phasing in a Local Product Brown and Caldwell 31
Phasing in a Local Product Brown and Caldwell 32
Conceptual Alternatives Brown and Caldwell 33
Project Cost Discussion Brown and Caldwell 34
Scale of the Project How to Manage Moving Ahead? Overall Scale of the Project Overall Scale of the Project For Talking Purposes For Talking Purposes Construction $85-$150M $15-$30/month Project Planning Level Cost Estimate Planning Level Rate Impact $111-$198M $20-$38/month Potential implications and considerations Potential implications and considerations Phase 2 will develop a Project cost for the selected alternative Interest in alternative/really innovative technologies (i.e., revised pass/fail criteria) perceived to be less expensive New incineration would likely within these ranges based on 2012 study information (to be confirmed) Do nothing represents risk ($) and significant OM ($) (and major capital project in near future anyway) Peer review to validate direction Brown and Caldwell 35
Next Steps Brown and Caldwell 36
Next Steps July 31 Public Workshop Summarize public feedback and how it was used Summarize TBL+ results and selected alternative Next Steps (Phase 2) Council briefing Brown and Caldwell 37