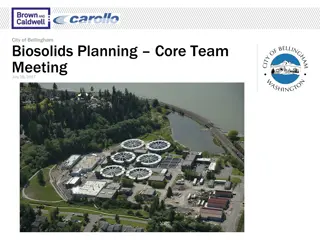
City of Bellingham Biosolids Planning Core Team Meeting Summary

The City of Bellingham held a Biosolids Planning Core Team Meeting on June 9, 2017, focusing on back injury prevention and discussing various topics such as offsite assessments, preliminary layouts, Sweet and GHG accounting results, TBL+ criteria, and next steps. The meeting emphasized the importance of maintaining back health through nutrition, exercise, and proper posture to prevent injuries. Key agenda items included reviewing meeting objectives, offsite assessments, and public input on TBL+ criteria. The team discussed potential offsite alternatives and evaluated parcels for viability. The meeting concluded with action items outlined for future steps in the planning process.

Download Presentation

Please find below an Image/Link to download the presentation.
The content on the website is provided AS IS for your information and personal use only. It may not be sold, licensed, or shared on other websites without obtaining consent from the author. Download presentation by click this link. If you encounter any issues during the download, it is possible that the publisher has removed the file from their server.
E N D
Presentation Transcript
City of Bellingham Biosolids Planning Core Team Meeting June 9, 2017
Health & Safety Minute: Back Care
Back Injuries are Common! 80% of Americans will have a back injury at some time Back injuries are the second most common cause of missing work (one million injuries per year) Injured backs are susceptible to re-injury Can lead to chronic pain Brown and Caldwell 3
Back Injury Prevention Nutrition Keep those extra pounds off to avoid overloading your back Exercise Keeps us flexible and works those supporting muscles Posture Lift with your legs Keep moving
Agenda Topic Topic Description Description Leader Leader Introduction (5 mins) Review agenda and meeting objectives Ian Offsite Assessment (10 mins) Overview of the offsite assessment that was conducted to identify representative sites as the basis for the Phase 1 TBL+ evaluation. Ian Preliminary Layouts (10 mins) Overview of the preliminary process layouts at Post Point that form the basis of the Phase 1 TBL+ Steve Preliminary SWEET and GHG Accounting Results (15 minutes) Overview of SWEET and GHG Accounting approach Review of preliminary results and assumptions Steve Preliminary TBL+ (90 mins) Summary of public input on TBL+ criteria Review preliminary TBL+ scoring (draft inputs for all categories are now available except cost factors) Confirm scoring approach and if criteria weighting is needed Susanna Next Steps (10 mins) Action Items Ian Brown and Caldwell 5
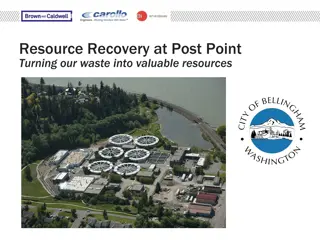
Offsite Assessment Brown and Caldwell 7
Offsite Assessment Objective Determine if an offsite alternative is viable for consideration Evaluated parcels within and near Bellingham for viability either as a soil blending site or as a remote solids processing facility Assumed trucking dewatered cake to an off-site facility (aka, Alternative 3) would need to be limited to within 25 miles of Post Point Assumed pumping undigested sludge to an offsite facility (aka Alternative 4) would need to be limited to within 10 miles of Post Point Brown and Caldwell 8
Offsite Considerations Advantages Advantages Easier implementation of co- digestion Reduces trucking and neighborhood impacts to Fairhaven Economy of scale/regional option Could preserve future capacity for Post Point Liquids treatment Could open door to privatization options Disadvantages Disadvantages Land purchase Permitting Conveyance from Post Point Operations staff at 2 locations Brown and Caldwell 9
Confirmed: Offsite Areas Available Brown and Caldwell 10
Preliminary Layouts Brown and Caldwell 11
Conceptual Alternatives Brown and Caldwell 12
Baseline: Post Point Today Brown and Caldwell 13
Alternative 1: Class B Digestion, Land Application Brown and Caldwell 14
Alternative 2: Class B Digestion + Dryer, Dried Fertilizer Product Brown and Caldwell 15
Alternative 3: Class A Digestion Onsite, Soil Blend Production Offsite Brown and Caldwell 16
Alternative 3: Class A Digestion Onsite, Soil Blend Production Offsite Brown and Caldwell 17
Alternative 4: Off-Site Class A Digestion and Soil Blend Production Brown and Caldwell 18
Future: Planning for Expansion Brown and Caldwell 19
Preliminary SWEET/GHG Accounting Results Brown and Caldwell 20
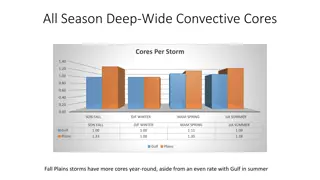
SWEET Output Alternative Average Daily Output Summary (Year 2035) Baseline Alt 1 Final Product, Wet (WT/day) 6 NG Req. (cf/day) 27120 Electricity Req. (kWh/day) 10345 Power Generation (kWh/day) 0 Net Power (kWh/day)* 10345 No. of Trucks Required (trucks/day) 0.19 Vehicle Fuel Consumed (gal/day) 17 Digester Gas Produced (scf/day)** 0 Methane Produced (scf/day)** 0 Polymer Use (kg/day) 191 *Negative net power represents power consumed; positive new power represents power produced **Alt 1,3,4, 90% biogas utilized in cogen. Alt 2, 70% biogas utilized in dryer. Remaining biogas is flared for all alternatives. Alt 2 12 0 14721 0 14721 Alt 3 105 0 10146 23194 -13048 Alt 4 105 0 13329 23194 -9865 51 0 9549 21019 -11471 1.71 154 364970 218982 215 0.61 24 364970 218982 215 5.02 38 402725 241635 202 3.50 26 402725 241635 202 Major Assumptions: Material dryness: Dewatered cake is 22% dry, dried product is 92% dry Volatile solids destruction: Mesophilic is 58%, TPAD is 64% Soil blend is 2:1:1 biosolids, sand, and sawdust (on a volume basis) Trucks can carry 30 tons or 35 cubic yards of material (dried product bulk density is 60% of water) Roundtrip trucking distances: 450 miles for Class B cake, 200 miles for dried product, 20 miles to offsite facility, 20 miles for local distribution of soil blend
GHG Accounting Bellingham Phase 1 Alternative Output Summary Greenhouse Gas Emissions, Tonne CO2e/year Baseline Consumption of Natural Gas 525 Consumption of Vehicle Fuel 65 Fugitive Emissions 1217 Scope 1 Total 1807 Alt 1 0 658 233 891 Alt 2 0 91 122 214 Alt 3 0 142 329 471 Alt 4 0 97 329 426 Scope 1 Electricity Required Power Generated Scope 2 Total 1767 0 1767 1631 -3591 -1959 2515 0 2515 1733 -3962 -2229 2277 -3962 -1685 Scope 2 Production of Polymer Production of Natural Gas Production of Vehicle Fuel Scope 3 Total 628 139 11 777 707 0 107 814 707 0 15 722 663 0 23 686 663 0 16 678 Scope 3 Fertilizer Offset Carbon Sequestration Credits Total 0 0 0 -781 -1027 -1808 -781 -1027 -1808 -698 -918 -1616 -698 -918 -1616 Credits Total, Tonne CO2e/Year Difference from Baseline 4350 0 (2063) (6413) 1642 (2708) (2688) (7038) (2197) (6547) Major Assumptions: Energy: 0.468 kg/kWh, 53 kg/MMBtu natural gas, 2.7 kg/liter diesel Fertilizer offset: 4 kg/kg-N, 2 kg/kg-P Carbon sequestration: 0.25 kg/kg-dry of biosolids Brown and Caldwell 22
Preliminary TBL+ Results Brown and Caldwell 23
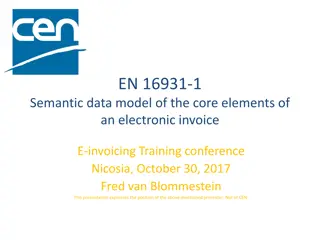
TBL+ Comparison of Alternatives 8 E2 Global Impact 7 E1 Local Impact Number of Objectives Met 6 S2 Assets E2 Global Impact 5 S1 Health & Safety S1 Health & Safety 4 F2 F2 E2 Life Cycle $ Life Cycle $ Global Impact 3 F1 E1 E1 F1 E1 Capital $ Local Impact Local Impact Capital $ Local Impact 2 T2 S2 S2 Assets T2 S2 Assets Assets Efficiency Efficiency 1 T1 T1 T1 S1 Health & Safety Reliability/ Performance Reliability/ Performance Reliability/ Performance 0 Ideal Alt. 1 Alt. 4 Alt. 3 Alternative
TBL+ Spreadsheet Brown and Caldwell 25
Next Steps Brown and Caldwell 26
Next Steps Complete cost estimates Finalize Phase 1 TBL+ evaluation TBL+ Workshop Schedule regulatory check ins Draft Technical Memorandum 1 Community Workshop and Council Briefing Final Phase 1 Technical Memorandum Proceed to Phase 2 Brown and Caldwell 27