Understanding the Law of Demand in Markets
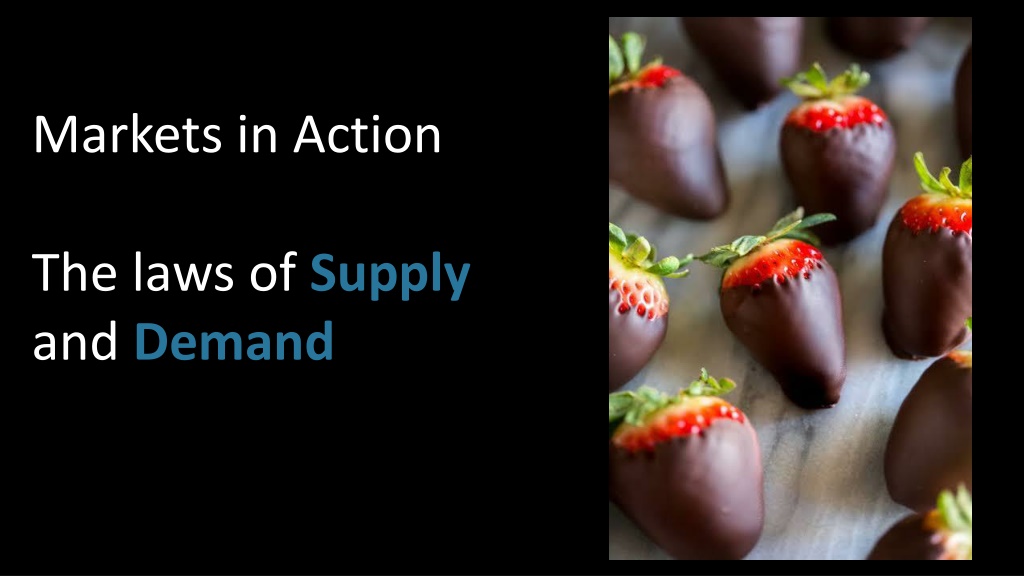
Markets in action demonstrate the laws of supply and demand, where buyers and sellers interact to determine economic output and price. The law of demand states that as prices rise, the quantity demanded decreases, leading to contraction, and vice versa. Through an example of chocolate-covered strawberries, the concept of demand elasticity is illustrated. Aunty Beryl's research reflects how price changes influence the quantity demanded, showcasing the fundamental principle of the law of demand.
Download Presentation

Please find below an Image/Link to download the presentation.
The content on the website is provided AS IS for your information and personal use only. It may not be sold, licensed, or shared on other websites without obtaining consent from the author. Download presentation by click this link. If you encounter any issues during the download, it is possible that the publisher has removed the file from their server.
E N D
Presentation Transcript
Markets in Action The laws of Supply and Demand
Demand An interaction between buyers (who demand goods and services) and sellers (who supply goods and services). We live in a market economy defined as freedom of choice and action between consumers and firms which determine economic output and price. Markets don t need to be a physical place.
The law of Demand Demand for a good or service can be defined as the quantity that buyers are willing and able to buy at a particular price. As the price of a good or service rises, the quantity demanded will fall. The opposite occurs when prices fall.
Expansion or contraction An increase in price will result in a contraction. At $5 per kilo, consumers would buy 100 kilos of apples, whereas, if the price rose to $10 per kilo, the demand would contract to 50 kilos.
Expansion or contraction A decrease in price will result in an expansion or extension of demand. At $4 per kilo, consumers would buy 100 kilos of tomato's, whereas, if the price drop to $2 per kilo, the demand would expand to 200 kilos.
Aunty Beryl wants to make and sell chocolate covered strawberries and conducts her research Luke Sarah Jayne Price per chocolate strawberry Quantity demanded per week Price per chocolate strawberry Quantity demanded per week Price per chocolate strawberry Quantity demanded per week 10 20 10 25 10 10 20 15 20 20 20 10 30 10 30 15 30 10 40 0 40 10 40 5 50 0 50 5 50 0 The Law of Demand is that the quantity demanded will decrease as the price increases.
Plot the following demand curve for chocolate strawberries A demand curve shows the quantity demanded at a range of prices Price Price per chocolate strawberry Quantity demanded per week 10 10000 20 8000 30 6000 40 4000 50 2000 Quantity
Changes in the demand curve Other than a change in the price of the item being plotted What is all wage earners received a tax cut? Demand for chocolate may increase greater number demanded at the same price. At $10, wage earners would buy 165 chocolates instead of 115.
What if there was a heatwave? Demand for chocolate may decrease less demand even though there has not been a price change. At $10, consumers would only buy 120.
The law of Supply Supply is the quantity of a good or service that producers are willing and able to supply at a particular price Chocolate covered strawberries
Aunty Beryl is one of may suppliers of chocolate strawberries in Adelaide all driven by a profit motive. Each willing to dip more strawberries in chocolate if they expect higher prices. Aunty Beryl The fine foods company Confectionary Supplies Price per chocolate strawberry Quantity demanded per week Price per chocolate strawberry Quantity demanded per week Price per chocolate strawberry Quantity demanded per week 10 50 10 250 10 600 20 100 20 500 20 600 30 150 30 750 30 600 40 200 40 1000 40 2000 50 250 50 1250 50 2000 The Law of Supply is that the quantity supplied will increase as the price rises.
Plot the following supply curve on the same graph as the demand curve for chocolate strawberries A supply curve shows the quantity supplied will increase as prices increase Price Price per chocolate strawberry Quantity demanded per week 10 2000 20 4000 30 6000 40 8000 50 10000 Quantity
Equilibrium the market price at which buyers want to buy the same quantity that sellers want to sell. This point it determined through interaction of supply and demand a point were both are satisfied market efficiency. Price Price per chocolate strawberry Quantity demanded per week 10 2000 20 4000 30 6000 40 8000 50 10000 Quantity
Shortage tells suppliers that they not only can produce more, but could also charge a higher price some consumers are prepared to pay more. Price Price per chocolate strawberry Quantity demanded per week 10 2000 20 4000 30 6000 SHORTAGE 40 8000 50 10000 Quantity
Shortage tells suppliers that they have produced too much and they need to encourage buyers back to the market by reducing prices and demanding more quantity. SURPLUS Price Price per chocolate strawberry Quantity demanded per week 10 2000 20 4000 30 6000 40 8000 50 10000 Quantity
Equilibrium the market price at which buyers want to buy the same quantity that sellers want to sell. This point it determined through interaction of supply and demand a point were both are satisfied market efficiency. Price Price per chocolate strawberry Quantity demanded per week 10 2000 20 4000 30 6000 40 8000 50 10000 Quantity
Shifts in supply and demand
