Understanding Bond and Bill Valuation in Financial Management
Exploring the concepts of valuing bonds and bills in financial management, covering topics such as interest rates, types of debt instruments, bill features, pricing examples, and parties involved in bills of exchange issuance.

Download Presentation

Please find below an Image/Link to download the presentation.
The content on the website is provided AS IS for your information and personal use only. It may not be sold, licensed, or shared on other websites without obtaining consent from the author. Download presentation by click this link. If you encounter any issues during the download, it is possible that the publisher has removed the file from their server.
E N D
Presentation Transcript
Financial Management Lecture 8: Valuing Bonds and Shares
Introduction We focus on debt instruments in this part Debt is where a company borrows money, which it will repay at some future time. Debt is given different names, depending upon how long the borrowing period is. Very broadly: Bills short term (less than a year) Notes medium term (1-10 years) Bonds long term (can be for longer than 10 years)
Bills of exchange A bill is a written order requiring one person to pay a fixed sum of money to another at a future date (maturity) The face value is the amount to be repaid at the end of the term (also called par value) There are no interest payments for a bill
Bill values and yields If a bill has: a face value is paid at maturity t periods to maturity; and a yield of i per period Face Value Bill Value = ? 1 + ? 365
Bill pricingExample The Blue Skies Company issues a bill with a face value of $100 000 and 60 days to maturity, with a yield of 3%. What would this bill sell for? (note: this is the amount of money the company will receive when they issue the bill) 100 000 (1+0.03 60 PV= =$99509.27 365)
More on bill features Three parties to a bill of exchange: 1. The drawer - wants to borrow the funds and is required to sign the face value of the bill. 2. The acceptor - agrees to pay the face value of the bill at maturity e.g. a bank. 3. The discounter (or endorser) - initially lends the funds and purchases the bill. The amount of funds the drawer will receive depends on the face value of the bill and the prevailing market rates (discount rate). The original discounter may hold the bill to maturity or sell it in the market before the maturity date. At the maturity date, the current holder of the bill will approach the acceptor for repayment. The acceptor is liable to pay the face value of the bill to the current holder and will recover the money from the drawer.
Issuing Bills of Exchange Money Drawer bill accepted (guaranteed) Acceptor Discounter Bill (promise to pay)
Selling Bills of Exchange Re-discounter (Buyer) Money (PV of Face Value) Discounter (Seller) Bill ( endorsed )
Bills of Exchange: Repayment Presents Bill for repayment Drawer Presents Bill for repayment Face Value Acceptor Current Holder Face Value
Bond definitions In contrast to bills, bonds are long term debt contracts that represent claims against a company s assets. They work like an interest-only loan The interest income paid to investors is fixed for the life of the contract why they are called fixed-income securities.
Corporate bonds Only a small number of the existing bonds actually trade on single day http://www.asx.com.au/asx/markets/interestRateSecurityPrices.do?type= CORPORATE_BOND Result: corporate bond market is thin (illiquid) compared to market for money market securities or corporate shares Corporate bonds are less marketable than securities with higher daily trading volumes (e.g. shares) Prices in corporate bond market also tend to be more volatile than securities sold in market with greater trading volumes 12
Corporate bonds Largest investors in corporate bonds are superannuation funds, investment funds and life insurance companies Trades in this market tend to be in very large blocks of securities Most secondary market corporate bond transactions take place through dealers in the over-the-counter (OTC) market. Corporate bond market not considered very transparent - difficult for investors to view prices, trading volume Further, many corporate bond transactions are negotiated between buyer and seller; there is little centralised reporting of these deals
Coupon bonds Coupon bonds pay fixed interest over the life of the bond At maturity, principal is paid and bonds are retired Features are as follows: FV CPN CPN CPN CPN CPN CPN CPN CPN CPN 0 1 2 3 4 5 n-3 n-2 n-1 n
Key features of a bond Face value: Also called par value What borrower will repay at maturity Assume $1000 for corporate bonds unless otherwise specified Coupon payments: Interest payments on bonds are called coupons The coupon rate is the rate at which coupons are paid Coupon amount is coupon rate*face value If not stated, assume bonds pay coupons twice per year and coupon rate is an APR that compounds semi annually
Key features of a bond (cont.) Maturity: Time at which bond must be repaid Yield to maturity (YTM): Sometimes simply called the yield for short The market required rate of return for bonds of similar risk and maturity The discount rate used to value a bond Return if bond held to maturity Quoted as an APR
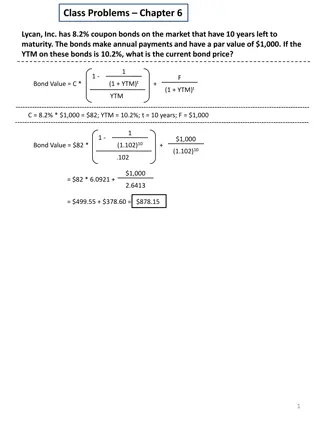
Bond Pricing Cash flows of a bond comprise: Regular interest payments of: o CPN = FV (coupon rate) (# coupons per year) Number of coupon payments: o n = (# coupons per year) (# years) Payment of face value at maturity FV CPN CPN CPN CPN CPN CPN CPN CPN CPN 0 1 2 3 4 5 n-3 n-2 n-1 n
The bond-pricing equation The price of a bond, like any other financial instrument, is the present value of its future cash flows: where, CPN = Coupon payment; i = Yields to Maturity (YTM) n = Number of Payments
Semi-annual bonds - Example What is the price of a bond which pays a 7% coupon semi-annually. Its yield to maturity is 8% and it will mature in 8 years. First, work out Number of coupon payments = = 2 x 8 years = 16 Semiannual coupon payment = (7% x face value)/2= $35 Semiannual yield (YTM) = 8%/2 = 4% Bond price? 1 (1+0.04) 16 0.04 1000 (1+0.04)16 = $941.74 = 35 +
Zero coupon bonds Companies sometimes issue bonds with no coupon payments, only offering one payment at maturity Consequently, to price a zero coupon bond, we just use an application of the present value of a lump sum formula Zero coupon bonds sell well below their face value (at a deep discount) because they offer no coupons Not frequently issued in Australia
Zero Coupon bonds YTM Example Suppose that a one-year, risk-free, zero-coupon bond with a $100,000 face value has an initial price of $96,618.36. What is the yield to maturity of the bond? The cash flows would be: 1 0 $96,618.36 +$100,000 96,618.36 =100,000 (1+???)1 ??? = 3.5%
Bond yields A bond s yield to maturity is the discount rate that makes the present value of coupon and principal payments equal to the price of the bond It is the yield that the investor earns if the bond is held to maturity, and all coupon and principal payments are made as promised A bond s yield to maturity changes daily as interest rates increase or decrease.
Coupon Bonds YTM Example An investor bought a three-year 6% coupon bond for $960.99 The bond pays coupons annually What is the investor s yield to maturity? 1 (1 + ?) 3 ? 1000 (1 + ?)3 $960.99 = 60 + ? = 7.5%
Pricing between coupons Remember that the present value of an annuity formula will give you the value one period before the first cash flow What about if you purchase the bond in between coupon payments?
Example: Adelaide Bank Pays coupons of 8.4% Matures end of June 2020 Pays interest quarterly Face value is $100 If you require a return of 7.5%, what would you pay for this note? Value the note as at end of August 2016
Adelaide Bank How many more coupons? When was the most recent coupon paid? When is the next coupon payment? How much is each coupon? What is the periodic yield? 16 June 2016 Sep 2016 $2.10 1.875% At what point in time does our bond formula compute the value? How can we adjust this? Just after last coupon (June 2016) 27
Example: Adelaide Bank $100 Draw a timeline here: $2.1 $2.1 $2.1 $2.1 $2.1 $2.1 $2.1 $2.1 $2.1 Jun 2016 Sep 2016 Dec 2016 Mar 2017 Jun 2017 Sep 2017 Sep 2019 Dec 2019 Mar 2020 Jun 2020 Hints: this bond is priced between coupons When you are drawing your timeline, it is best to start at maturity and work backwards to today The first cash flow you should draw on your timeline is the maturity value, then put in the prior coupon, then the coupon before that and backwards sequentially this will help you to work out what n should be
Working Spaces: C 1 + F + = + Bond Value 1 - n n i (1 ) (1 i) i 2.1 1 100 = + 1 - + + 16 16 0.01875 (1 0.01875) (1 0.01875) = 103 09 . At what point in time is this? June 2016 We need to value the bond at end of August 2016 How? We need to compound it for two months Remember that cash flows are quarterly How many months are there in a quarter? So what fraction of a quarter is two months? 2 3 ( ) 103.09 x 1.01875 104.37 = 29
Bond Relationship I: Coupon rate vs. Yields to Maturity A bond s coupon rate = yield to maturity, bond will sell at price equal to its face value; these are called par bonds. A bond s coupon rate is < yield to maturity, then bond will sell at price less than its face value; these are called discount bonds A bond s coupon rate > yield to maturity, then bond will sell at price more than its face value; these are called premium bonds
Bond Relationship II: Effect of Time and Bond Price Holding all other things constant, the price of discount or premium bond will move towards par value over time.
What Affect Yields? The yields on corporate bonds are determined by the riskiness of the company issuing the bond (its ability to repay) and also the characteristics of the bond There are four risk characteristics that are responsible for most of the differences in corporate borrowing costs: Security s marketability Call feature Default risk Term to maturity
The structure of interest rates Marketability is an investor s ability to sell a security quickly at low transaction cost, and at its fair market value (liquidity) Question: There are two bonds A and B. The bonds have the same features (coupons rate, maturity etc). However, bond A is more marketable than bond B. Which bond would you prefer? Which bond would you be willing to pay more for? What does this mean about the yield? You would prefer the more marketable bond bond A Therefore would pay more for bond A Therefore the yield would be lower (remember: inverse relation between yield and price)
The structure of interest rates Call Provision gives the company issuing the bonds the option to purchase the bond from an investor at a predetermined price (the call price) Investor must sell the bond at that price
The structure of interest rates Question: there are two bonds C and D. The bonds have the same features (coupons rate, maturity etc). However, bond C is callable. Which bond would you be willing to pay more for? What does this mean about the yield? When bonds are called, investors suffer financial loss because they are forced to surrender their high-yielding bonds and reinvest their funds at lower prevailing market rate of interest Therefore investors do not like callable bonds prefer bond D Bond D s price will be higher and yield will be lower
The structure of interest rates Default Risk is the risk the that the lender may not receive payments as promised Question: there are two bonds E and F. The bonds have the same features (coupons rate, maturity etc). However, bond F is more likely to default. Which bond would you be willing to pay more for? What does this mean about the yield? Would be willing to pay more for bond E - investors must be paid a premium to purchase a security that exposes them to default risk Bond E would have a lower yield
Bond ratings Individuals and small businesses must rely on outside agencies for information on the potential that a bond issuer may default Two most prominent credit rating agencies: Moody s Investors Service (Moody s) and Standard & Poor s (S&P) Both credit rating services rank bonds in order of expected probability of default; publish ratings as letter grades Fitch is a third widely-used credit ratings agency
Bond ratings Highest grade bonds, those with lowest default risk, are rated Aaa (or AAA) Investment grade bonds , those in the top four rating categories, are rated Aaa (AAA) to Baa (BBB) Some laws require banks, insurance companies, superannuation funds, other financial institutions, government agencies to purchase only investment grade securities Speculative Bonds (BB D) Also known as Junk Bonds or High-Yield Bonds
The structure of interest rates The term structure of interest rates is the relationship between yield and term to maturity Yield curves depict graphically how market yields vary as term to maturity changes Shape of yield curve is not constant over time As the general level of interest rises and falls over time, yield curve shifts up and down and has different slopes
The structure of interest rates Three basic shapes (slopes) of yield curves in the marketplace: 1. Ascending or normal yield curves are upward sloping yield curves that occur when the economy is growing 2. Descending or inverted yield curves are downward sloping yield curves that occur when economy is declining or heading into recession 3. Flat yield curves imply interest rates are unlikely to change in near future
Australian zero-coupon yield curve at four different points in time
Convertible bonds Bonds that can be converted into ordinary shares at a pre-determined ratio at the discretion of the bondholder Convertible feature allows bondholders to share company s good fortunes if the company s shares rise above certain level Conversion ratio is set so company s share price must appreciate 15%-20% before it is profitable to convert bonds into equity To secure this advantage, bondholders willing to pay a premium
Ordinary shares High-risk investments Higher expected returns Voting rights Limited loss liability, unlimited return potential From the company s perspective: can be useful to avoid paying a dividend cost of financing can be high over the long term paying dividends does not bring any tax relief, making $1 of dividend more expensive than $1 of loan interest Shareholders 1 2 N-1 N Company Assets FINM7409
Valuing shares Investors make a return on their shares from two types of cash flows: Dividends received over the life of the share Capital gains the difference between what the share is bought and sold for Just like for any asset, the price of a share is the present value of its future cash flows, i.e., the present value of the dividends and the eventual sale price
Types of equity securities Valuing a share is more difficult than valuing a bond because: 1. In contrast to coupon payments on bonds, the size and timing of dividend cash flows are less certain 2. Ordinary shares are true perpetuities in that they have no final maturity date. 3. Unlike rate of return (yield) on bonds, rate of return on ordinary shares cannot be observed directly. There is a very famous finance model called the Capital Asset Pricing Model (CAPM). This is used to calculate the required return for an equity investment, based on, amongst other factors, the share s risk. We will examine this model later in the course. For this seminar we will tell you the discount rate, or assume we can back it out given the current price.
One-period example Suppose you are thinking of purchasing the stock of Moore Oil Ltd. You expect it to pay a $2 dividend in one year. You believe you can sell the stock for $14 at that time. You require a return of 20% on investments of this risk. Note that this rate is called the return on equity What is the maximum you would be willing to pay?
One-period example (cont.) D1 = $2 dividend expected in one year R = 20% P1 = $14 CF1 = $2 + $14 = $16 Compute the PV of the expected cash flows This is simply a PV of a lump sum paid in one period + 2 ( 14 ) = = $ 13 33 . P 0 . 1 20
One-period example (cont.) If we know the current and future price of the share and only one dividend is paid, at the same time as the share is sold, we can back out the return (called the return on equity) + P D = 1 1 1 P 0 + r e + P D = 1 1 1 r e P 0 OR + P D P = 1 1 0 r e P 0
Two-period example What if you decide to hold the share for two years? In addition to the dividend in one year, you expect a dividend of $2.10 and a share price of $14.70 at the end of year 2. Now how much would you be willing to pay? + 2 ( 2 . 10 14 . 70 ) = + = P $ 13 . 33 0 2 1 . 20 ( 1 . 20 )


")
")


")
")