Statistical Analysis Practice Questions with Solutions
Practice various statistical analysis concepts including categorical and quantitative variables, mean calculations, distribution summaries, ogive interpretation, and data display techniques through a series of questions and images. Enhance your statistical knowledge and problem-solving skills with these challenging exercises.
- Statistical analysis
- Practice questions
- Categorical variables
- Quantitative variables
- Data interpretation

Download Presentation

Please find below an Image/Link to download the presentation.
The content on the website is provided AS IS for your information and personal use only. It may not be sold, licensed, or shared on other websites without obtaining consent from the author. Download presentation by click this link. If you encounter any issues during the download, it is possible that the publisher has removed the file from their server.
E N D
Presentation Transcript
More Practice Chapters 2 through 4
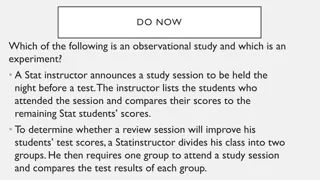
We collect these data from 50 male students. Which variable is categorical? A) eye color B) head circumference C) hours of homework last week D) number of cigarettes smoked daily E) number of TV sets at home
The mean number of hours worked for the 30 males was 6, and for the 20 females was 9. The overall mean number of hours worked A) is 6.5 B) is 7.2 C) is 7.5 D) is none of these. E) cannot be determined.
We might choose to display data with a stemplot rather than a boxplot because a stemplot I. reveals the shape of the distribution. II. is better for large data sets. III. displays the actual data. A) I only B) II only C) III only D) I and III E) I, II, and III
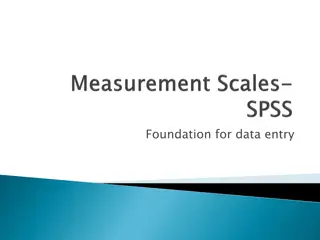
Which is true of the data whose distribution is shown? I. The distribution is skewed to the right. II. The mean is probably smaller than the median. III. We should summarize with mean and standard deviation. A) I only B) II only C) I and II D) II and III E) I, II, and III
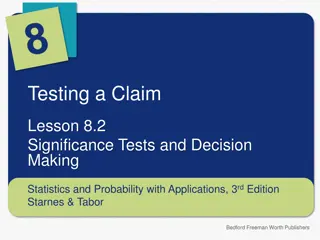
The ages of people attending the opening show of a new movie are summarized in the ogive shown. Estimate the IQR of the ages. A) 5 B) 13 C) 21 D) 30 E) 37
Environmental researchers have collected rain acidity data for several decades. They want to see if there is any evidence that attempts to reduce industrial pollution have produced a trend toward less acidic rainfall. They should display their data in a(n) A) contingency table B) bar graph C) boxplot D) histogram E) timeplot
School administrators collect data on students attending the school. Which of the following variables is quantitative? A) class (freshman, soph., junior, senior) B) grade point average C) whether the student is in AP* classes D) whether the student has taken the SAT E) none of these
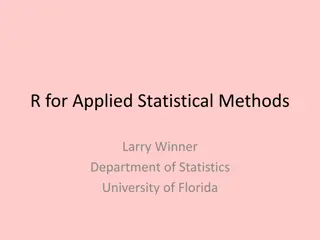
Which is true of the data shown in the histogram? I. The distribution is approximately symmetric. II. The mean and median are approximately equal. III. The median and IQR summarize the data better than the mean and standard deviation. A) I only B) III only C) I and II D) I and III E) I, II, and III
A professor has kept records on grades that students have earned in his class. If he wants to examine the percentage of students earning the grades A, B, C, D, and F during the most recent term, which kind of plot could he make? A) boxplot B) timeplot C) dotplot D) pie chart E) histogram
The five-number summary of credit hours for 24 students in a statistics class is: Which statement is true? A) There are no outliers in the data. B) There is at least one low outlier in the data. C) There is at least one high outlier in the data. D) There are both low and high outliers in the data. E) None of the above.
One day a store tracked the way shoppers paid for their purchases. Their data are summarized in the table. a. What percent of the men paid cash? b. What is the conditional relative frequency distribution of payment method for women? c. If you wanted to show the association between gender and method of payment visually, what kind of graph would you make? (Just name it.) d. Is there evidence of an association between gender and method of payment? Explain briefly.
a. 45% b. 30% cash, 20% check, 50% charge c. segmented bar graphs, or pie charts d. Yes. Women are more likely to charge their purchases than men (50% to 30%) and less likely to pay cash (30% to 45%).
An automobile service shop reported the summary statistics shown for repair bills (in $) for their customers last month. a. Were any of the bills outliers? Show how you made your decision. b. After checking out a problem with your car the service manager gives you an estimate of only $90. Is he right to imply that your bill will be unusually low? Explain briefly.
a. Yes. IQR = 308 88 = 220. The upper fence for outliers is one and a half IQR s above the third quartile, or 308 + 1.5(220) = 638. The maximum repair bill was $1442, well above $638, so it is certainly an outlier. b. No. $90 is higher than over 25% of the bills, so it is not unusually low.
The World Almanac and Book of Facts 2004 reported the percent of people not covered by health insurance in the 50 states and Washington, D.C., for the year 2002.Computer output gives these summaries for the percent of people not covered by health insurance: a. Were any of the states outliers? Explain how you made your decision. b. A histogram of the data is as follows: Is it more appropriate to use the mean and standard deviation or the median and IQR to describe these data? Explain.
a. IQR = Q3 Q1 = 16.7 10.8 = 5.9 1.5(IQR) = 1.5(5.9) = 8.85 Q3 + 1.5(IQR) = 16.7 + 8.85 = 25.55 < Max, so there is at least one high outlier Q1 1.5(IQR) = 10.8 8.85 = 1.95 < Min, so there are no low outliers b. It is more appropriate to use the median and IQR to describe these data, since the distribution is skewed right.
2013 #6 We are only considering one variable the yearly frequency. We are NOT using the year. Now compare the distributions. Note that the horizontal axis is reversed.