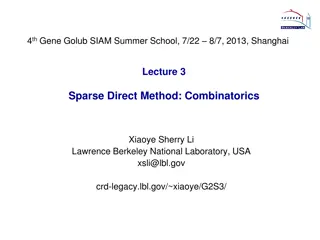
Statistical Genomics Lecture 5: Linear Algebra Homework Questions
Explore the concepts of random variables, covariance matrix, special matrices, and self-defined functions in statistical genomics through a series of homework questions. Gain insights into linear algebra and statistical genomics while working on Homework 1, analyzing the expectation and variance of random variables, and developing custom R functions. Dive into the world of Chi-square distributions and learn about the implications of sample size on expectation and variance. Enhance your understanding of statistical genomics and linear algebra with examples, self-defined functions, and practical applications.

Download Presentation

Please find below an Image/Link to download the presentation.
The content on the website is provided AS IS for your information and personal use only. It may not be sold, licensed, or shared on other websites without obtaining consent from the author. Download presentation by click this link. If you encounter any issues during the download, it is possible that the publisher has removed the file from their server.
E N D
Presentation Transcript
Statistical Genomics Lecture 5: Linear Algebra Zhiwu Zhang Washington State University
Administration Homework1, due next Wednesday, Feb 1, 3:10PM
Outline Example of first question on homework1 Expectation and Variance of random variable Expectation and Variance of function of random variable Covariance Matrix and manipulations Special matrices: Identity, symmetric, diagonal, singular, and orthogonal Rank
Question 1 in Homework1 Start from random variables with standard normal distribution, define your own random variable that is function of the normal distributed variables. Name the random variable as your last name and develop a R function to generate the random variable. The input of your R function should include n, which is number variables to be generated, and parameters for the distribution of the random variable you defined. Note: try not to be the same as the known distributions such as Chi-square, F and t.
Example of Chi-square distribution Histogram of x 3000 25 2500 20 2000 #There is a function in R x=rchisq(n=10000,df=5) #Expectation is df and var=2df Frequency 15 1500 x 1000 10 500 5 par(mfrow=c(2,2),mar = c(3,4,1,1)) plot(x) hist(x) plot(density(x)) plot(ecdf(x)) mean(x) var(x) 0 0 0 2000 4000 6000 8000 10000 0 5 10 15 20 25 density.default(x = x) ecdf(x) 0.15 1.0 0.8 0.10 0.6 Density Fn(x) 0.4 0.05 0.2 0.00 0.0 0 5 10 15 20 25 30 0 5 10 15 20 25 30
Self-defined function of Chi-square density.default(x = x1) 0.15 rZhang=function(n=10,df=2){ y=replicate(n,{ x=rnorm(df,0,1) y=sum(x^2) }) return(y) } 0.10 Density 0.05 x1=rchisq(n=10000,df=5) x2=rZhang(n=10000,df=5) plot(density(x1),col="blue") lines(density(x2),col="red") 0.00 0 5 10 15 20 25 N = 10000 Bandwidth = 0.4239
Expectation=Mean when sample size goes to infinity Histogram of x 5 4 Frequency 3 2 par(mfrow=c(3,1),mar = c(3,4,1,1)) x=rchisq(n=10,df=5) hist(x) abline(v=mean(x), col = "red") 1 0 2 4 6 8 10 12 Histogram of x 25 20 x=rchisq(n=100,df=5) hist(x) abline(v=mean(x), col = "red") Frequency 15 10 5 0 x=rchisq(n=10000,df=5) hist(x) abline(v=mean(x), col = "red") 0 5 10 15 Histogram of x 2500 Frequency 1500 500 0 0 5 10 15 20
Variance Range Average deviation from mean, but it is always zero Average squared deviation from mean: Variance Square root of variance = standard deviation n=100 x=rnorm(100,100,5) c(min(x),max(x)) sum(x-mean(x))/(n-1) sum((x-mean(x))^2)/ sqrt(sum((x-mean(x))^2)/(n-1))
Expectation and variance of linear function of random variables n=10000 df=10 x=rchisq(n,df) y=ax, E(y)=aE(x), Var(y)=a^2*Var(x) y=x+a, E(y)=E(x)+a, Var(y)=Var(x) mean(x) var(x) y=5*x mean(y) var(y) z=5+x mean(z) var(z)
Covariance 25 20 n=10000 x=rpois(n, 100) y=rchisq(n,5) z=rt(n,100) par(mfrow=c(3,1),mar = c(3,4,1,1)) plot(x,y) plot(x,z) plot(y,z) 15 y 10 5 0 60 80 100 120 140 4 2 z 0 -2 var(x) var(y) var(z) cov(x,y) cov(x,z) cov(y,z) -4 60 80 100 120 140 4 2 z 0 -2 -4 0 5 10 15 20 25
Covariance 130 120 110 n=10000 a=rnorm(n,100,5) x=a+rpois(n, 100) y=a+rchisq(n,5) z=a+rt(n,100) par(mfrow=c(3,1),mar = c(3,4,1,1)) plot(x,y) plot(x,z) plot(y,z) y 100 90 80 160 180 200 220 240 120 110 100 z 90 80 var(x) var(y) var(z) cov(x,y) cov(x,z) cov(y,z) 160 180 200 220 240 120 110 100 z 90 80 80 90 100 110 120 130
Formula of covariance Cov(x,y)= sum( (x- mean(x)) * (y- mean(y)) )/(n-1) sum((x-mean(x))*(y-mean(y)))/(n-1) sum((x-mean(x))*(z-mean(z)))/(n-1) sum((y-mean(y))*(z-mean(z)))/(n-1)
Calculation in R W=cbind(x,y,z) dim(W) cov(W) var(W)
Element-wise Matrix manipulations Add/ subtraction (dot)product (dot)division a=matrix(seq(10,60,10),2,3) b=matrix(seq(1,6),2,3) a b a+b a-b a*b a/b
Multiplication AS 1 BS 2 MS 3 PhD 4 Salary SQF Mean 20000 1000 Mean 1 1 Education 1 4 Age 30 50 Edu 10000 300 Age 1000 20 Salary 60000 110000 SQF 1900 3200 c=matrix(c(1,1,1,4,30,50),2,3) b=matrix(c(20000,10000,1000,1000,300,20),3,2) t=c%*%b
Inverse IF: 1 A B = 1 1 Inverse is for square matrix only B is inverse of A vice versa
Inverse in R: solve() t ti=solve(t) ti ti %*% t t%*%ti
Transpose Transpose c=matrix(c(1,1,1,4,30,50),2,3) c t(c)
Properties of transpose (AT)T=A (A+B)T=AT+BT (AB)T=BTAT (cB)T=cBT , where c is scalar A=matrix(c(1,1,1,4,30,50),2,3) B=matrix(c(1000,300,20,20000,10000,1000),3 ,2) t(A%*%B) t(B)%*%t(A)
Special matrix Symmetric: A=Transpose(A) Diagonal matrix: all elements are 0 except diagonals Identity: Diagonals=1 and res=0 Orthogonal: A multiply by transpose (A) = Identity Singular: A square matrix does not have a inverse
Rank The size of the largest non-singular sub matrix Full rank matrix: rank=dimension
Highlight Example of first question on homework1 Expectation and Variance of random variable Expectation and Variance of function of random variable Covariance Matrix and manipulations Special matrices: Identity, symmetric, diagonal, singular, and orthogonal Rank


")