Understanding Sampling Plans in Statistical Analysis


Sampling is the foundation of statistical analysis.
S
a
m
p
l
i
n
g
p
l
a
n
-
a
d
e
s
c
r
i
p
t
i
o
n
o
f
t
h
e
a
p
p
r
o
a
c
h
t
h
a
t
i
s
u
s
e
d
t
o
o
b
t
a
i
n
s
a
m
p
l
e
s
f
r
o
m
a
p
o
p
u
l
a
t
i
o
n
p
r
i
o
r
t
o
a
n
y
d
a
t
a
c
o
l
l
e
c
t
i
o
n
a
c
t
i
v
i
t
y
.
A sampling plan states:
- its objectives
- target population
- population frame (the list from which the sample is
selected)
- operational procedures for collecting data
- statistical tools for data analysis
A company wants to understand how golfers might
respond to a membership program that provides
discounts at golf courses.
◦
Objective
- estimate the proportion of golfers who would join the
program
◦
Target population
- golfers over 25 years old
◦
Population frame
- golfers who purchased equipment at particular
stores
◦
Operational procedures
- e-mail link to survey or direct-mail
questionnaire
◦
Statistical tools
- PivotTables to summarize data by demographic
groups and estimate likelihood of joining the program
Subjective Methods
J
u
d
g
m
e
n
t
s
a
m
p
l
i
n
g
–
e
x
p
e
r
t
j
u
d
g
m
e
n
t
i
s
u
s
e
d
t
o
s
e
l
e
c
t
t
h
e
s
a
m
p
l
e
C
o
n
v
e
n
i
e
n
c
e
s
a
m
p
l
i
n
g
–
s
a
m
p
l
e
s
a
r
e
s
e
l
e
c
t
e
d
b
a
s
e
d
o
n
t
h
e
e
a
s
e
w
i
t
h
w
h
i
c
h
t
h
e
d
a
t
a
c
a
n
b
e
c
o
l
l
e
c
t
e
d
Probabilistic Sampling
S
i
m
p
l
e
r
a
n
d
o
m
s
a
m
p
l
i
n
g
i
n
v
o
l
v
e
s
s
e
l
e
c
t
i
n
g
i
t
e
m
s
f
r
o
m
a
p
o
p
u
l
a
t
i
o
n
s
o
t
h
a
t
e
v
e
r
y
s
u
b
s
e
t
o
f
a
g
i
v
e
n
s
i
z
e
h
a
s
a
n
e
q
u
a
l
c
h
a
n
c
e
o
f
b
e
i
n
g
s
e
l
e
c
t
e
d
Sales Transactions
database
Data > Data Analysis > Sampling
Periodic
selects every
n
th
number
Random
selects a simple random sample
Sampling is done
with
replacement
so duplicates
may occur.
S
y
s
t
e
m
a
t
i
c
(
p
e
r
i
o
d
i
c
)
s
a
m
p
l
i
n
g
–
a
s
a
m
p
l
i
n
g
p
l
a
n
t
h
a
t
s
e
l
e
c
t
s
e
v
e
r
y
n
t
h
i
t
e
m
f
r
o
m
t
h
e
p
o
p
u
l
a
t
i
o
n
.
S
t
r
a
t
i
f
i
e
d
s
a
m
p
l
i
n
g
–
a
p
p
l
i
e
s
t
o
p
o
p
u
l
a
t
i
o
n
s
t
h
a
t
a
r
e
d
i
v
i
d
e
d
i
n
t
o
n
a
t
u
r
a
l
s
u
b
s
e
t
s
(
c
a
l
l
e
d
s
t
r
a
t
a
)
a
n
d
a
l
l
o
c
a
t
e
s
t
h
e
a
p
p
r
o
p
r
i
a
t
e
p
r
o
p
o
r
t
i
o
n
o
f
s
a
m
p
l
e
s
t
o
e
a
c
h
s
t
r
a
t
u
m
.
C
l
u
s
t
e
r
s
a
m
p
l
i
n
g
-
b
a
s
e
d
o
n
d
i
v
i
d
i
n
g
a
p
o
p
u
l
a
t
i
o
n
i
n
t
o
s
u
b
g
r
o
u
p
s
(
c
l
u
s
t
e
r
s
)
,
s
a
m
p
l
i
n
g
a
s
e
t
o
f
c
l
u
s
t
e
r
s
,
a
n
d
(
u
s
u
a
l
l
y
)
c
o
n
d
u
c
t
i
n
g
a
c
o
m
p
l
e
t
e
c
e
n
s
u
s
w
i
t
h
i
n
t
h
e
c
l
u
s
t
e
r
s
s
a
m
p
l
e
d
S
a
m
p
l
i
n
g
f
r
o
m
a
c
o
n
t
i
n
u
o
u
s
p
r
o
c
e
s
s
◦
Select a time at random; then select the next n items produced after that
time.
◦
Select
n
times at random; then select the next item produced after each
of these times.
E
s
t
i
m
a
t
i
o
n
i
n
v
o
l
v
e
s
a
s
s
e
s
s
i
n
g
t
h
e
v
a
l
u
e
o
f
a
n
u
n
k
n
o
w
n
p
o
p
u
l
a
t
i
o
n
p
a
r
a
m
e
t
e
r
u
s
i
n
g
s
a
m
p
l
e
d
a
t
a
E
s
t
i
m
a
t
o
r
s
a
r
e
t
h
e
m
e
a
s
u
r
e
s
u
s
e
d
t
o
e
s
t
i
m
a
t
e
p
o
p
u
l
a
t
i
o
n
p
a
r
a
m
e
t
e
r
s
◦
E.g., sample mean, sample variance, sample proportion
A
p
o
i
n
t
e
s
t
i
m
a
t
e
i
s
a
s
i
n
g
l
e
n
u
m
b
e
r
d
e
r
i
v
e
d
f
r
o
m
s
a
m
p
l
e
d
a
t
a
t
h
a
t
i
s
u
s
e
d
t
o
e
s
t
i
m
a
t
e
t
h
e
v
a
l
u
e
o
f
a
p
o
p
u
l
a
t
i
o
n
p
a
r
a
m
e
t
e
r
.
I
f
t
h
e
e
x
p
e
c
t
e
d
v
a
l
u
e
o
f
a
n
e
s
t
i
m
a
t
o
r
e
q
u
a
l
s
t
h
e
p
o
p
u
l
a
t
i
o
n
p
a
r
a
m
e
t
e
r
i
t
i
s
i
n
t
e
n
d
e
d
t
o
e
s
t
i
m
a
t
e
,
t
h
e
e
s
t
i
m
a
t
o
r
i
s
s
a
i
d
t
o
b
e
u
n
b
i
a
s
e
d
.
S
a
m
p
l
i
n
g
(
s
t
a
t
i
s
t
i
c
a
l
)
e
r
r
o
r
o
c
c
u
r
s
b
e
c
a
u
s
e
s
a
m
p
l
e
s
a
r
e
o
n
l
y
a
s
u
b
s
e
t
o
f
t
h
e
t
o
t
a
l
p
o
p
u
l
a
t
i
o
n
◦
Sampling error is inherent in any sampling process,
and although it
can be minimized, it cannot be totally
avoided.
N
o
n
s
a
m
p
l
i
n
g
e
r
r
o
r
o
c
c
u
r
s
w
h
e
n
t
h
e
s
a
m
p
l
e
d
o
e
s
n
o
t
r
e
p
r
e
s
e
n
t
t
h
e
t
a
r
g
e
t
p
o
p
u
l
a
t
i
o
n
a
d
e
q
u
a
t
e
l
y
.
◦
Nonsampling error usually results from a poor sample
design or inadequate data reliability.
A population is uniformly distributed between 0
and 10.
◦
Mean = (0 + 10)/2 = 5
◦
Variance = (10 − 0)
2
/12 = 8.333
Experiment:
◦
Generate 25 samples of size 10 from this population.
◦
Compute the mean of each sample.
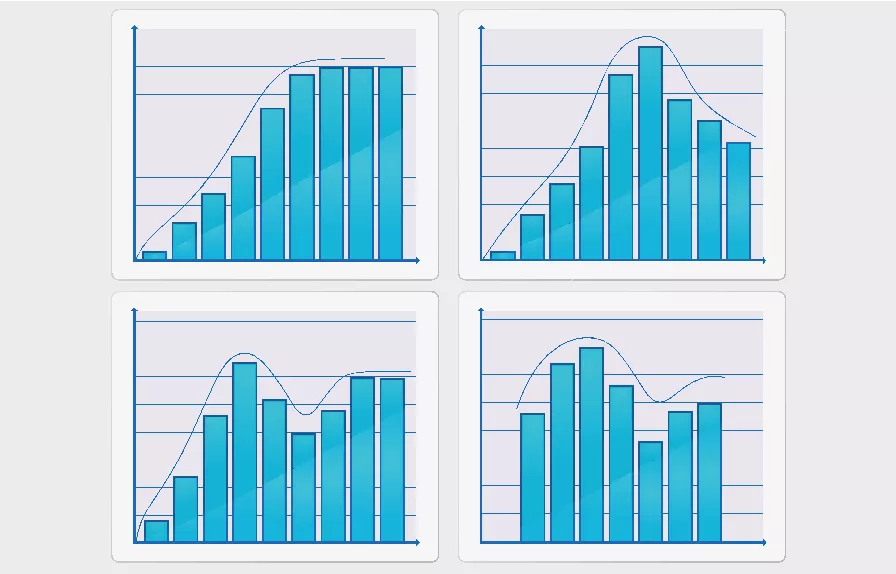
◦
Prepare a histogram of the 250 observations,
◦
Prepare a histogram of the 25 sample means.
◦
Repeat for larger sample sizes and draw comparative
conclusions.
Note that the average of all the sample means
is quite close the true population mean of 5.0.
Repeat the sampling experiment for samples of size 25,
100, and 500
As the sample
size increases, the
average of the sample
means are all still close
to the expected value of
5; however, the standard
deviation of the sample
means becomes smaller,
meaning that the means
of samples are clustered
closer together around
the true expected value.
The distributions
become normal.
Using the empirical rule for 3 standard deviations
away from the mean, ~99.7% of sample means
should be between:
[2.55, 7.45] for
n
= 10
[3.65, 6.35] for
n
= 25
[4.09, 5.91] for
n
= 100
[4.76, 5.24] for
n
= 500
As the sample size increases, the sampling error
decreases.
T
h
e
s
a
m
p
l
i
n
g
d
i
s
t
r
i
b
u
t
i
o
n
o
f
t
h
e
m
e
a
n
i
s
t
h
e
d
i
s
t
r
i
b
u
t
i
o
n
o
f
t
h
e
m
e
a
n
s
o
f
a
l
l
p
o
s
s
i
b
l
e
s
a
m
p
l
e
s
o
f
a
f
i
x
e
d
s
i
z
e
n
f
r
o
m
s
o
m
e
p
o
p
u
l
a
t
i
o
n
.
T
h
e
s
t
a
n
d
a
r
d
d
e
v
i
a
t
i
o
n
o
f
t
h
e
s
a
m
p
l
i
n
g
d
i
s
t
r
i
b
u
t
i
o
n
o
f
t
h
e
m
e
a
n
i
s
c
a
l
l
e
d
t
h
e
s
t
a
n
d
a
r
d
e
r
r
o
r
o
f
t
h
e
m
e
a
n
:
As
n
increases, the standard error decreases.
◦
Larger sample sizes have less sampling error.
For the uniformly distributed population, we found
2
= 8.333 and, therefore,
= 2.89
1. If the sample size is large enough, then the sampling
distribution of the mean is:
- approximately normally distributed
regardless
of the distribution of the population
- has a mean equal to the population mean
2. If the population is normally distributed, then the
sampling distribution is also normally distributed for
any
sample size.
◦
The central limit theorem allows us to use the theory we learned
about calculating probabilities for normal distributions to draw
conclusions about sample means.
The key to applying sampling distribution of the
mean correctly is to understand whether the
probability that you wish to compute relates to an
individual observation
or to the
mean of a sample
.
◦
If it relates to the mean of a sample, then you must use
the sampling distribution of the mean, whose standard
deviation is the standard error,
not
the standard deviation
of the population.
The purchase order amounts for books on a publisher’s Web site is
normally distributed with a mean of $36 and
a standard deviation of
$8.
Find the probability that:
a) someone’s purchase amount exceeds $40.
Use the population standard deviation:
P(x
> 40) = 1− NORM.DIST(40, 36, 8, TRUE) = 0.3085
b) the
mean
purchase amount for 16 customers exceeds $40.
Use the standard error of the mean:
P(x
> 40) = 1− NORM.DIST(40, 36, 2, TRUE) = 0.0228
A
n
i
n
t
e
r
v
a
l
e
s
t
i
m
a
t
e
p
r
o
v
i
d
e
s
a
r
a
n
g
e
f
o
r
a
p
o
p
u
l
a
t
i
o
n
c
h
a
r
a
c
t
e
r
i
s
t
i
c
b
a
s
e
d
o
n
a
s
a
m
p
l
e
.
◦
Intervals specify a range of plausible values for the characteristic
of interest and a way of assessing “how plausible” they are.
I
n
g
e
n
e
r
a
l
,
a
1
0
0
(
1
-
)
%
p
r
o
b
a
b
i
l
i
t
y
i
n
t
e
r
v
a
l
i
s
a
n
y
i
n
t
e
r
v
a
l
[
A
,
B
]
s
u
c
h
t
h
a
t
t
h
e
p
r
o
b
a
b
i
l
i
t
y
o
f
f
a
l
l
i
n
g
b
e
t
w
e
e
n
A
a
n
d
B
i
s
1
-
.
◦
Probability intervals are often centered on the mean or median.
◦
Example: in a normal distribution, the mean plus or minus 1
standard deviation describes an approximate 68% probability
interval around the mean.
A Gallup poll might report that 56% of voters
support a certain candidate with a margin of error
of ± 3%.
◦
We would have a lot of confidence that the candidate
would win since the interval estimate is [53%, 59%]
Suppose the poll reported a 52% level of support
with a ± 4% margin of error.
◦
We would be less confident in predicting a win for the
candidate since the interval estimate is [48%, 56%].
A
c
o
n
f
i
d
e
n
c
e
i
n
t
e
r
v
a
l
i
s
a
r
a
n
g
e
o
f
v
a
l
u
e
s
b
e
t
w
e
e
n
w
h
i
c
h
t
h
e
v
a
l
u
e
o
f
t
h
e
p
o
p
u
l
a
t
i
o
n
p
a
r
a
m
e
t
e
r
i
s
b
e
l
i
e
v
e
d
t
o
b
e
,
a
l
o
n
g
w
i
t
h
a
p
r
o
b
a
b
i
l
i
t
y
t
h
a
t
t
h
e
i
n
t
e
r
v
a
l
c
o
r
r
e
c
t
l
y
e
s
t
i
m
a
t
e
s
t
h
e
t
r
u
e
(
u
n
k
n
o
w
n
)
p
o
p
u
l
a
t
i
o
n
p
a
r
a
m
e
t
e
r
.
◦
T
h
i
s
p
r
o
b
a
b
i
l
i
t
y
i
s
c
a
l
l
e
d
t
h
e
l
e
v
e
l
o
f
c
o
n
f
i
d
e
n
c
e
,
d
e
n
o
t
e
d
b
y
1
-
,
w
h
e
r
e
i
s
a
n
u
m
b
e
r
b
e
t
w
e
e
n
0
a
n
d
1
.
◦
The level of confidence is usually expressed as a percent;
common values are 90%, 95%, or 99%.
For a 95% confidence interval, if we chose 100 different
samples, leading to 100 different interval estimates, we
would expect that 95% of them would contain the true
population mean.
Sample mean
±
margin of error
Margin of error is:
±
z
α
/2
(standard error)
z
α
/2
is the value of the standard normal random variable for
an upper tail area of
α
/2
(or a lower tail area of 1 −
α
/2
).
◦
z
α
/2
is computed as =NORM.S.INV(1 –
/2)
◦
Example: if
= 0.05 (for a 95% confidence interval), then
NORM.S.INV(0.975) = 1.96;
◦
Example: if
= 0.10 (for a 90% confidence interval), then
NORM.S.INV(0.95) = 1.645,
The margin of error can also be computed by
=CONFIDENCE.NORM(
alpha, standard_deviation, size
)
.
A production process fills bottles of liquid detergent. The
standard deviation in filling volumes is constant at 15
mls. A sample of 25 bottles revealed a mean filling
volume of 796 mls.
A 95% confidence interval estimate of the mean filling
volume for the population is
The worksheet
Population Mean Sigma Known
in the
Excel workbook
Confidence Intervals
computes this
interval using the CONFIDENCE.NORM function
As the level of confidence, 1 -
, decreases,
z
/2
decreases, and the confidence interval becomes
narrower.
◦
For example, a 90% confidence interval will be narrower than a
95% confidence interval. Similarly, a 99% confidence interval will
be wider than a 95% confidence interval.
Essentially, you must trade off a higher level of accuracy
with the risk that the confidence interval does not contain
the true mean.
◦
To reduce the risk, you should consider increasing the sample
size.
T
h
e
t
-
d
i
s
t
r
i
b
u
t
i
o
n
i
s
a
f
a
m
i
l
y
o
f
p
r
o
b
a
b
i
l
i
t
y
d
i
s
t
r
i
b
u
t
i
o
n
s
w
i
t
h
a
s
h
a
p
e
s
i
m
i
l
a
r
t
o
t
h
e
s
t
a
n
d
a
r
d
n
o
r
m
a
l
d
i
s
t
r
i
b
u
t
i
o
n
.
D
i
f
f
e
r
e
n
t
t
-
d
i
s
t
r
i
b
u
t
i
o
n
s
a
r
e
d
i
s
t
i
n
g
u
i
s
h
e
d
b
y
a
n
a
d
d
i
t
i
o
n
a
l
p
a
r
a
m
e
t
e
r
,
d
e
g
r
e
e
s
o
f
f
r
e
e
d
o
m
(
d
f
)
.
◦
As the number of degrees of freedom increases, the t-distribution
converges to the standard normal distribution
where
t
α
/2
is the value of the
t
-distribution with
df
=
n
− 1 for an upper tail area of
α
/2.
t
values are found in Table 2 of Appendix A or with the
Excel function
T.INV(1 –
/2, n – 1).
The Excel function
=CONFIDENCE.T(
alpha, standard_deviation, size
)
can be used to compute the margin of error
Excel file
Credit Approval Decisions.
Find a 95% confidence interval
estimate of the mean revolving balance of homeowner applicants
(first, sort the data by homeowner).
Sample mean = $12,630.37;
s
= $5393.38; standard error =
$1037.96; t
0.025, 26
= 2.056.
12,630.37 ± 2.056(5393.38/√27)
An unbiased estimator of a population proportion
(this is
not
the number pi = 3.14159 …) is the
statistic
pˆ = x / n
(the sample proportion), where
x
is the number in the sample having the desired
characteristic and
n
is the sample size.
A 100(1 –
)% confidence interval for the
proportion is
Excel file
Insurance Survey
.
We are interested in the
proportion of individuals who would be willing to pay a
lower premium for a higher deductible for their health
insurance.
◦
Sample proportion = 6/24 = 0.25.
Confidence interval:
In Example 6.8, the required volume for the bottle-filling
process is 800 and the sample mean is 796 mls. We
obtained a confidence interval [790.12, 801.88]. Should
machine adjustments be made?
Although the sample mean is
less than 800, the sample does
not provide sufficient evidence
to draw that conclusion that the
population mean is less than
800 because 800 is contained
within the confidence interval.
An exit poll of 1,300 voters found that 692 voted for a particular
candidate in a two-person race. This represents a proportion of
53.23% of the sample. Could we conclude that the candidate will
likely win the election?
A 95% confidence interval for the proportion is [0.505, 0.559]. This
suggests that the population proportion of voters who favor this
candidate is highly likely to exceed 50%, so it is safe to predict the
winner.
If the sample proportion is 0.515,the confidence interval for the
population proportion is [0.488, 0.543]. Even though the sample
proportion is larger than 50%, the sampling error is large, and the
confidence interval suggests that it is reasonably likely that the true
population proportion could be less than 50%, so you cannot predict
the winner.
A
p
r
e
d
i
c
t
i
o
n
i
n
t
e
r
v
a
l
i
s
o
n
e
t
h
a
t
p
r
o
v
i
d
e
s
a
r
a
n
g
e
f
o
r
p
r
e
d
i
c
t
i
n
g
t
h
e
v
a
l
u
e
o
f
a
n
e
w
o
b
s
e
r
v
a
t
i
o
n
f
r
o
m
t
h
e
s
a
m
e
p
o
p
u
l
a
t
i
o
n
.
◦
A confidence interval is associated with the sampling
distribution of a statistic, but a prediction interval is
associated with the distribution of the random variable
itself.
A 100(1 –
)% prediction interval for a new
observation is
Compute a 95% prediction interval for the revolving
balances of customers (
Credit Approval Decisions
)
We can determine the appropriate sample size needed
to estimate the population parameter within a specified
level of precision (±
E
).
Sample size for the mean:
Sample size for the proportion:
◦
Use the sample proportion from a preliminary sample as an
estimate of
or set p = 0.5 for a conservative estimate to
guarantee the required precision.
In Example 6.8, the sampling error was ± 5.88 mls.
What is sample size is needed to reduce the margin of
error to at most 3 mls?
Round up to
97 samples
.
For the voting example we discussed, suppose
that we wish to determine the number of voters to
poll to ensure a sampling error of at most ± 2%.
With no information, use
= 0.5:
Sampling is vital for statistical analysis, with sampling plans detailing objectives, target populations, operational procedures, and statistical tools. Different sampling methods like judgmental, convenience, and probabilistic sampling are used to select samples. Estimation involves assessing unknown population parameters using estimators like sample mean and variance. The process is crucial for companies like golf clubs aiming to gauge customer response and make informed decisions.

Download Presentation

Please find below an Image/Link to download the presentation.
The content on the website is provided AS IS for your information and personal use only. It may not be sold, licensed, or shared on other websites without obtaining consent from the author. Download presentation by click this link. If you encounter any issues during the download, it is possible that the publisher has removed the file from their server.
E N D
Presentation Transcript
Sampling is the foundation of statistical analysis. Sampling plan - a description of the approach that is used to obtain samples from a population prior to any data collection activity. A sampling plan states: - its objectives - target population - population frame (the list from which the sample is selected) - operational procedures for collecting data - statistical tools for data analysis
A company wants to understand how golfers might respond to a membership program that provides discounts at golf courses. Objective - estimate the proportion of golfers who would join the program Target population - golfers over 25 years old Population frame - golfers who purchased equipment at particular stores Operational procedures - e-mail link to survey or direct-mail questionnaire Statistical tools - PivotTables to summarize data by demographic groups and estimate likelihood of joining the program
Subjective Methods Judgment sampling expert judgment is used to select the sample Convenience sampling samples are selected based on the ease with which the data can be collected Probabilistic Sampling Simple random sampling involves selecting items from a population so that every subset of a given size has an equal chance of being selected
Sales Transactions database Data > Data Analysis > Sampling Periodic selects every nthnumber Random selects a simple random sample Sampling is done with replacement so duplicates may occur.
Systematic (periodic) sampling a sampling plan that selects every nth item from the population. Stratified sampling applies to populations that are divided into natural subsets (called strata) and allocates the appropriate proportion of samples to each stratum. Cluster sampling - based on dividing a population into subgroups (clusters), sampling a set of clusters, and (usually) conducting a complete census within the clusters sampled Sampling from a continuous process Select a time at random; then select the next n items produced after that time. Select n times at random; then select the next item produced after each of these times.
Estimation involves assessing the value of an unknown population parameter using sample data Estimators are the measures used to estimate population parameters E.g., sample mean, sample variance, sample proportion A point estimate is a single number derived from sample data that is used to estimate the value of a population parameter. If the expected value of an estimator equals the population parameter it is intended to estimate, the estimator is said to be unbiased.
Sampling (statistical) error occurs because samples are only a subset of the total population Sampling error is inherent in any sampling process, and although it can be minimized, it cannot be totally avoided. Nonsampling error occurs when the sample does not represent the target population adequately . Nonsampling error usually results from a poor sample design or inadequate data reliability.
A population is uniformly distributed between 0 and 10. Mean = (0 + 10)/2 = 5 Variance = (10 0)2/12 = 8.333 Experiment: Generate 25 samples of size 10 from this population. Compute the mean of each sample. Prepare a histogram of the 250 observations, Prepare a histogram of the 25 sample means. Repeat for larger sample sizes and draw comparative conclusions.
Note that the average of all the sample means is quite close the true population mean of 5.0.
Repeat the sampling experiment for samples of size 25, 100, and 500 As the sample size increases, the average of the sample means are all still close to the expected value of 5; however, the standard deviation of the sample means becomes smaller, meaning that the means of samples are clustered closer together around the true expected value. The distributions become normal.
Using the empirical rule for 3 standard deviations away from the mean, ~99.7% of sample means should be between: [2.55, 7.45] for n = 10 [3.65, 6.35] for n = 25 [4.09, 5.91] for n = 100 [4.76, 5.24] for n = 500 As the sample size increases, the sampling error decreases.
The sampling distribution of the mean is the distribution of the means of all possible samples of a fixed size n from some population. The standard deviation of the sampling distribution of the mean is called the standard error of the mean: As n increases, the standard error decreases. Larger sample sizes have less sampling error.
For the uniformly distributed population, we found 2= 8.333 and, therefore, = 2.89
1. If the sample size is large enough, then the sampling distribution of the mean is: - approximately normally distributed regardless of the distribution of the population - has a mean equal to the population mean 2. If the population is normally distributed, then the sampling distribution is also normally distributed for any sample size. The central limit theorem allows us to use the theory we learned about calculating probabilities for normal distributions to draw conclusions about sample means.
The key to applying sampling distribution of the mean correctly is to understand whether the probability that you wish to compute relates to an individual observation or to the mean of a sample. If it relates to the mean of a sample, then you must use the sampling distribution of the mean, whose standard deviation is the standard error, not the standard deviation of the population.
The purchase order amounts for books on a publishers Web site is normally distributed with a mean of $36 and a standard deviation of $8. Find the probability that: a) someone s purchase amount exceeds $40. Use the population standard deviation: P(x> 40) = 1 NORM.DIST(40, 36, 8, TRUE) = 0.3085 b) the mean purchase amount for 16 customers exceeds $40. Use the standard error of the mean: P(x> 40) = 1 NORM.DIST(40, 36, 2, TRUE) = 0.0228
An interval estimate provides a range for a population characteristic based on a sample. Intervals specify a range of plausible values for the characteristic of interest and a way of assessing how plausible they are. In general, a 100(1 - )% probability interval is any interval [A, B] such that the probability of falling between A and B is 1 - . Probability intervals are often centered on the mean or median. Example: in a normal distribution, the mean plus or minus 1 standard deviation describes an approximate 68% probability interval around the mean.
A Gallup poll might report that 56% of voters support a certain candidate with a margin of error of 3%. We would have a lot of confidence that the candidate would win since the interval estimate is [53%, 59%] Suppose the poll reported a 52% level of support with a 4% margin of error. We would be less confident in predicting a win for the candidate since the interval estimate is [48%, 56%].
A confidence interval is a range of values between which the value of the population parameter is believed to be, along with a probability that the interval correctly estimates the true (unknown) population parameter. This probability is called the level of confidence, denoted by 1 - , where is a number between 0 and 1. The level of confidence is usually expressed as a percent; common values are 90%, 95%, or 99%. For a 95% confidence interval, if we chose 100 different samples, leading to 100 different interval estimates, we would expect that 95% of them would contain the true population mean.
Sample mean margin of error Margin of error is: z /2(standard error) z /2is the value of the standard normal random variable for an upper tail area of /2(or a lower tail area of 1 /2). z /2is computed as =NORM.S.INV(1 /2) Example: if = 0.05 (for a 95% confidence interval), then NORM.S.INV(0.975) = 1.96; Example: if = 0.10 (for a 90% confidence interval), then NORM.S.INV(0.95) = 1.645, The margin of error can also be computed by =CONFIDENCE.NORM(alpha, standard_deviation, size).
A production process fills bottles of liquid detergent. The standard deviation in filling volumes is constant at 15 mls. A sample of 25 bottles revealed a mean filling volume of 796 mls. A 95% confidence interval estimate of the mean filling volume for the population is
The worksheet Population Mean Sigma Known in the Excel workbook Confidence Intervals computes this interval using the CONFIDENCE.NORM function
As the level of confidence, 1 - , decreases, z/2 decreases, and the confidence interval becomes narrower. For example, a 90% confidence interval will be narrower than a 95% confidence interval. Similarly, a 99% confidence interval will be wider than a 95% confidence interval. Essentially, you must trade off a higher level of accuracy with the risk that the confidence interval does not contain the true mean. To reduce the risk, you should consider increasing the sample size.
The t-distribution is a family of probability distributions with a shape similar to the standard normal distribution. Different t-distributions are distinguished by an additional parameter, degrees of freedom (df). As the number of degrees of freedom increases, the t-distribution converges to the standard normal distribution
where t/2is the value of the t-distribution with df = n 1 for an upper tail area of /2. t values are found in Table 2 of Appendix A or with the Excel function T.INV(1 /2, n 1). The Excel function =CONFIDENCE.T(alpha, standard_deviation, size) can be used to compute the margin of error
Excel file Credit Approval Decisions. Find a 95% confidence interval estimate of the mean revolving balance of homeowner applicants (first, sort the data by homeowner). Sample mean = $12,630.37; s = $5393.38; standard error = $1037.96; t0.025, 26 = 2.056. 12,630.37 2.056(5393.38/ 27)
An unbiased estimator of a population proportion (this is not the number pi = 3.14159 ) is the statistic p = x / n (the sample proportion), where x is the number in the sample having the desired characteristic and n is the sample size. A 100(1 )% confidence interval for the proportion is
Excel file Insurance Survey. We are interested in the proportion of individuals who would be willing to pay a lower premium for a higher deductible for their health insurance. Sample proportion = 6/24 = 0.25. Confidence interval:
In Example 6.8, the required volume for the bottle-filling process is 800 and the sample mean is 796 mls. We obtained a confidence interval [790.12, 801.88]. Should machine adjustments be made? Although the sample mean is less than 800, the sample does not provide sufficient evidence to draw that conclusion that the population mean is less than 800 because 800 is contained within the confidence interval.
An exit poll of 1,300 voters found that 692 voted for a particular candidate in a two-person race. This represents a proportion of 53.23% of the sample. Could we conclude that the candidate will likely win the election? A 95% confidence interval for the proportion is [0.505, 0.559]. This suggests that the population proportion of voters who favor this candidate is highly likely to exceed 50%, so it is safe to predict the winner. If the sample proportion is 0.515,the confidence interval for the population proportion is [0.488, 0.543]. Even though the sample proportion is larger than 50%, the sampling error is large, and the confidence interval suggests that it is reasonably likely that the true population proportion could be less than 50%, so you cannot predict the winner.
A prediction interval is one that provides a range for predicting the value of a new observation from the same population. A confidence interval is associated with the sampling distribution of a statistic, but a prediction interval is associated with the distribution of the random variable itself. A 100(1 )% prediction interval for a new observation is
Compute a 95% prediction interval for the revolving balances of customers (Credit Approval Decisions)
We can determine the appropriate sample size needed to estimate the population parameter within a specified level of precision ( E). Sample size for the mean: Sample size for the proportion: Use the sample proportion from a preliminary sample as an estimate of or set p = 0.5 for a conservative estimate to guarantee the required precision.
In Example 6.8, the sampling error was 5.88 mls. What is sample size is needed to reduce the margin of error to at most 3 mls? Round up to 97 samples.
For the voting example we discussed, suppose that we wish to determine the number of voters to poll to ensure a sampling error of at most 2%. With no information, use = 0.5:


 sampling – a sampling plan that")

 error occurs because")