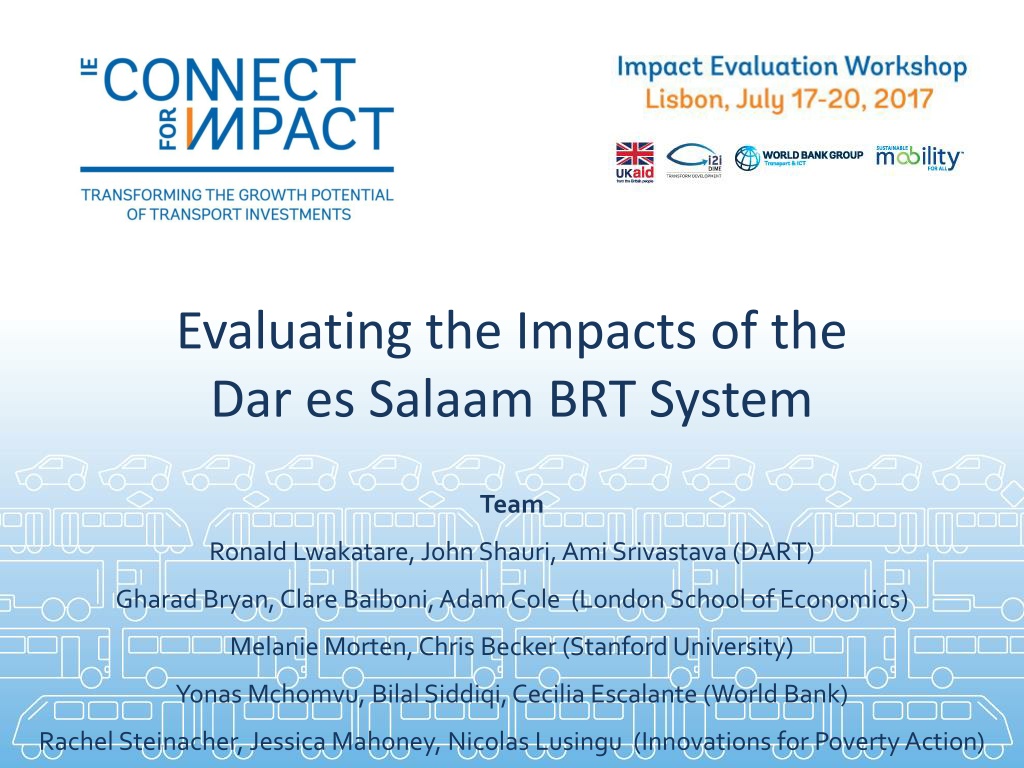
Impact Evaluation of Dar es Salaam Bus Rapid Transit System
Evaluating the impacts of the Dar es Salaam BRT system, this study aims to understand how the BRT has affected travel times, job creation, income boost, firm productivity, property values, road safety, and overall well-being of residents. The evaluation approach includes spatial triple-differences analysis, mechanism experiments like fare subsidies and cash transfers, and structural modeling to estimate general equilibrium impacts. The study also involves baseline surveys and tracking samples to assess the effects of the BRT system.

Download Presentation

Please find below an Image/Link to download the presentation.
The content on the website is provided AS IS for your information and personal use only. It may not be sold, licensed, or shared on other websites without obtaining consent from the author. Download presentation by click this link. If you encounter any issues during the download, it is possible that the publisher has removed the file from their server.
E N D
Presentation Transcript
Evaluating the Impacts of the Dar es Salaam BRT System Team Ronald Lwakatare, John Shauri, Ami Srivastava (DART) Gharad Bryan, Clare Balboni, Adam Cole (London School of Economics) Melanie Morten, Chris Becker (Stanford University) Yonas Mchomvu, Bilal Siddiqi, Cecilia Escalante (World Bank) Rachel Steinacher, Jessica Mahoney, Nicolas Lusingu (Innovations for Poverty Action)
Dar es Salaam Bus Rapid Transit System Phase 1 of (6 phase) Dar es Salaam BRT Opened May 2016 21km of bus ways, 5 terminals, 2 depots, 27 bus stations Connects high-income CBD with middle/low-income residential areas First operational BRT in East Africa
We would like to know: does the Dar BRT Reduce travel times? Create jobs and boost income? Encourage firm productivity, trade and growth? Improve property values? Make roads safer? Increase the health, wealth and happiness of Dar residents especially the poorest?
Evaluation approach aims to estimate the impacts of BRT Phase 1 Understand how the BRT has affected the lives and welfare of residents As well as the impacts on urban neighborhoods, development and growth and understand the mechanisms through which impacts happen e.g. through greater mobility? Relocation of people/firms? while laying the groundwork to evaluate future phases Phases 2, 3 planned in the near future, 4-6 later on Don t want to reinvent the wheel for future evaluations! and providing information relevant to for other contexts! Should inform BRTs planned in other African cities, elsewhere in the world
Combination of methods used to achieve this 1. Spatial triple-differences approach Compare places (i) near and far from Phase 1 with places (ii) near and far from planned Phase 2, (iii) before and after Phase 1. 2. Mechanism experiments (randomized controlled trials) Temporary fare subsidies to encourage (some) commuters to use BRT compare to control group to understand impacts of using the BRT Spatially conditional cash transfers to encourage (some) residents to stay where they are, or relocate to understand BRT s impacts on relocation and urban development 3. Structural modeling to estimate general equilibrium impacts Mechanism experiments will produce key elasticities for model Allow findings to be applied to other contexts
What we have been up to so far Jan 2016: Baseline surveys Travel time survey Household survey May 2016: BRT Phase 1 Opens Mar 2017: Tracking baseline sample Household tracking survey Mobile survey enrolment May 2017 (onwards): Mobile survey SMS- and call-based Semi-monthly to panel of respondents
Spatial triple differences approach We are trying to understand if the BRT caused changes in outcomes of interest Want to make sure that changes were not caused by other things If BRT went to neighborhoods that were richer, we would see more jobs, higher income but not caused by BRT! If rich people moved away from BRT areas, we would see less income but not caused by BRT either! Need a comparison ( control ) group Find locations and individuals that look just like those affected by BRT Compare treatment and control groups just like a medical experiment!
Spatial triple differences approach Compare places (i) near and far from Phase 1 with places (ii) near and far from planned Phase 2, (iii) before and after Phase 1. Difference 1:Compare A* to B* = Difference 2: Compare to difference between A and B Difference 3: Compare these differences before and after Phase 1
Baseline data collection (Jan 2016) Dense geographical sampling strategy ensures coverage inside and outside catchment areas of Phase 1 Surveyed 1749 households from sampled neighborhoods Data can be used as baseline for impact evaluation of future phases
What we plan to do next! Follow-up survey of baseline sample Estimate short-term (18 month) impacts Experiments to understand mechanisms of change to develop this week Experiment 1: Fare subsidies Objectives: (i) to measure direct effects of riding the BRT and (ii) to understand access issues Experiment 2: Spatially Conditional Cash Transfers Objective: to understand relocation and urban development due to BRT
What we plan to do for the next 3 years! July-Aug 2017 Qualitative study of urban housing market To inform the feasibility and design of housing RCT Sep 2017 Follow-up survey 1 Reinterview all baseline respondents Oct-Dec 2017 Analysis First set of spatial triple-diff results Presented and disseminated Jan-Feb 2018 Housing RCT launch Sample enrolment and baseline survey Disbursement of first set of cash transfers Oct 2018 Follow-up survey 2 Reinterview all baseline respondents Will provide 2-year impacts Nov-Dec 2018 Fare RCT launch Sample enrolment and baseline survey Disbursement of 6-month smartcards Jan 2019 Housing RCT endline Feb Jun 2019 Analysis Second set of spatial triple-diff results Results from housing RCT Presented and disseminated July 2019 Fare RCT endline Aug 2019-Jun 2020 Analysis Results from fare RCT Results from structural modeling exercise Final results presented and disseminated


")
")