Tracer Study Overview at Gualala CSD WWTP
A tracer study was conducted at the Gualala Community Services District Wastewater Treatment Plant to evaluate the modal contact time for the underground pipeline. The study included the installation of a second orifice pipeline jetting system to enhance mixing within the pipeline. Tracer material details, testing results, and operational parameters were analyzed to improve overall pipe mixing efficiency. The study aimed to determine the hydraulic residence time and optimize chlorine contact for effective water treatment processes.

Download Presentation

Please find below an Image/Link to download the presentation.
The content on the website is provided AS IS for your information and personal use only. It may not be sold, licensed, or shared on other websites without obtaining consent from the author. Download presentation by click this link. If you encounter any issues during the download, it is possible that the publisher has removed the file from their server.
E N D
Presentation Transcript
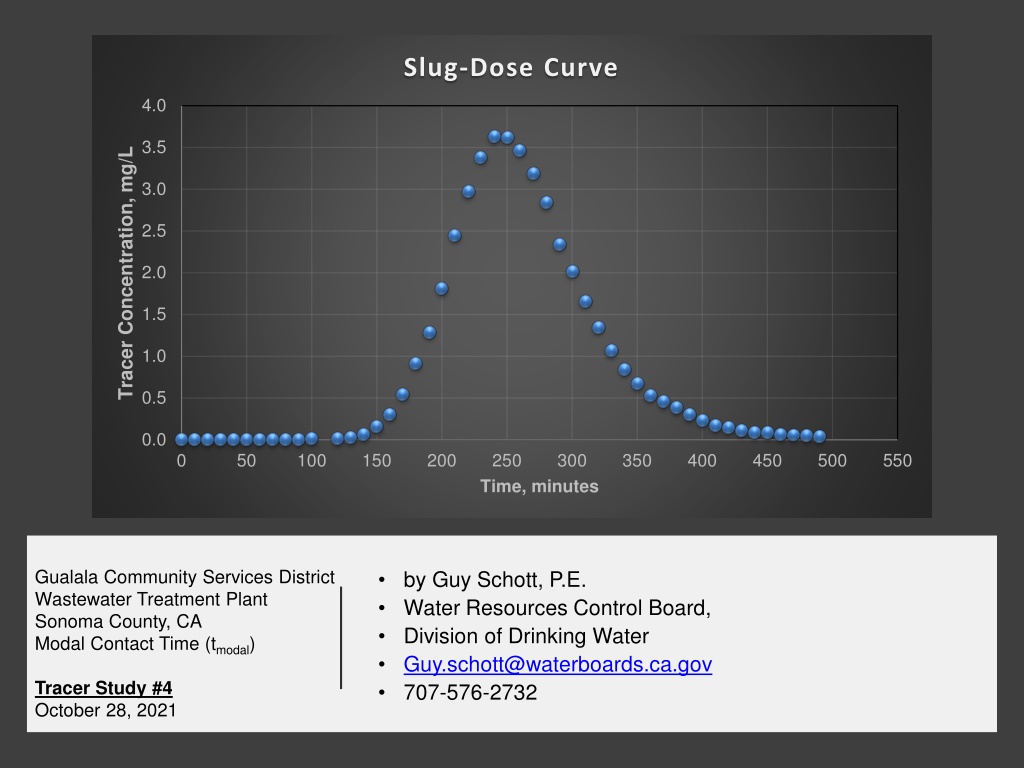
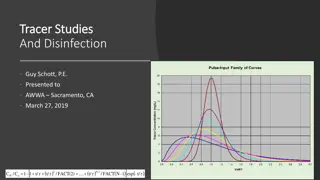
Slug-Dose Curve 4.0 3.5 Tracer Concentration, mg/L 3.0 2.5 2.0 1.5 1.0 0.5 0.0 0 50 100 150 200 250 Time, minutes 300 350 400 450 500 550 Gualala Community Services District Wastewater Treatment Plant Sonoma County, CA Modal Contact Time (tmodal) by Guy Schott, P.E. Water Resources Control Board, Division of Drinking Water Guy.schott@waterboards.ca.gov 707-576-2732 Tracer Study #4 October 28, 2021
Chlorine Contact - Pipeline Manhole "B" Mixing Zone (orifice spray) 1 HP Manhole "C" Mixing Zone (orifice spray) 2 HP Pipeline volume: 21,500 gallons (4-ft Dia. x 229-feet length) Manhole C + pre-piping volume: ~910 gallons Manhole B volume: ~ 390 gallons Total Contact Volume: 22,800 gallons Pipeline L:D ratio: 57 Average treated water flows (Sea Ranch and Gualala): 95 gpm 2 x Orifice Pipelines: 1.5 PVC, 80-ft, 1/8 holes spaced 18 inches
Results Test Date: October 28, 2021 Test by: Gualala Community Services District & Division of Drinking Water Tracer Test Method: Slug-Dose using Fluoride Total Volume (manholes and pipeline: 22,800 gallons (operating volume) Average flow to Modal Contact Time: 95 gpm HRT: 240 minutes (4.0 hours) tmodal: 240 minutes (to peak fluoride concentration @ 95 gpm) Modal Baffling Factor (tmodal/HRT): 1.0 Minimum chlorine residual to meet CT of 450 mg/L*min as 95 gpm: 1.9 mg/L Cl2
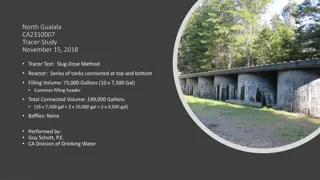
Tracer Study Overview 1 On October 28, 2021, a fourth tracer study was conducted at the Gualala CSD WWTP. This test was to evaluate the modal contact time for the underground 4-ft diameter concrete pipeline (229-ft) for a second orifice pipeline jetting system installed into Manhole B and pipeline. Each Manhole pipeline now has an 80-foot long, 1.5-in diameter PVC pipe with 1/8 orifices spaced 18-inches to promote mixing within the 21,500- gallon underground concrete pipeline. The added jetting mixing system improved overall pipe mixing resulting in a modal contact time equal to the hydraulic residence time (HRT).
Tracer Study Overview 2 Tracer Method: Slug-Dose Injection Point of Tracer: Poured into filter overflow weir connected to 8-inch line Sample Point: Pipeline outlet (Manhole B ) Tracer Analysis: Ion Selective Fluoride Probe Sampler: Gualala CSD Operators Analyses by: Guy Schott, Division of Drinking Water
Tracer Material Overview Tracer Material: Hydrofluorosillicic Acid (H2SiF6) Tracer Bulk Density: 10.3 lbs/gal Tracer Product Strength: 24% as H2SiF6 Molecular Weight: 144.09 g/mole (H2SiF6) Fluoride Concentration: 79.11% (144 g/mole) H2SiF6 Tracer Added: ~750 mL Fluoride mixed w/1.25 gal of water in bucket Fluoride (F) Tracer Added: 174 g Method of Injection: Slug-Dose (poured, < 20 sec) Fluoride (F) mass recovered: 168.5 g (97%)
Pipeline Contactor (21,500 gallons) Added Tracer Tracer Sampling
Tracer Slug-Dose Adding Tracer
Hydraulic Tracer Mixing After tracer is poured into effluent filter trough, the mixed water flows into an 8- in line to Manhole C .
Manhole C Entry to Pipeline Manhole C
Manhole B Pipeline Exit - Sample Station Manhole B Sample Tap
Gualala Community Services District - Wastewater Treatment Plant Test: Slug Dose Piple Volume: 21,500 gal Elapsed Time, hrs Total Volume: 22,800 gal Elapsed Time, min Test Date: Total Flow gpm 28-Oct-21 Tracer F mg/L Elapsed Time, min Sample Interval, min Total Flow gpm Tracer F mg/L Elapsed Time, hrs Sample Interval, min Sample # Sample # 0 0 0 Hr, 00 min 0 81 0.081 25 250 4 Hr, 10 min 10 107 3.70 1 10 0 Hr, 10 min 10 81 0.079 26 260 4 Hr, 20 min 10 153 3.55 2 20 0 Hr, 20 min 10 89 0.077 27 270 4 Hr, 30 min 10 52 3.27 3 30 0 Hr, 30 min 10 91 0.078 28 280 4 Hr, 40 min 10 103 2.92 4 40 0 Hr, 40 min 10 97 0.077 29 290 4 Hr, 50 min 10 101 2.42 5 50 0 Hr, 50 min 10 101 0.078 30 300 5 Hr, 00 min 10 106 2.10 6 60 1 Hr, 00 min 10 102 0.077 31 310 5 Hr, 10 min 10 105 1.74 7 70 1 Hr, 10 min 10 99 0.082 32 320 5 Hr, 20 min 10 113 1.43 8 80 1 Hr, 20 min 10 98 0.080 33 330 5 Hr, 30 min 10 112 1.15 9 90 1 Hr, 30 min 10 97 0.079 34 340 5 Hr, 40 min 10 107 0.925 10 100 1 Hr, 40 min 10 93 0.092 35 350 5 Hr, 50 min 10 102 0.750 11 110 1 Hr, 50 min 10 91 0.079 36 360 6 Hr, 00 min 10 97 0.613 12 120 2 Hr, 00 min 10 94 0.092 37 370 6 Hr, 10 min 10 68 0.537 13 130 2 Hr, 10 min 10 98 0.102 38 380 6 Hr, 20 min 10 136 0.463 14 140 2 Hr, 20 min 10 96 0.142 39 390 6 Hr, 30 min 10 109 0.382 15 150 2 Hr, 30 min 10 92 0.238 40 400 6 Hr, 40 min 10 117 0.316 16 160 2 Hr, 40 min 10 90 0.387 41 410 6 Hr, 50 min 10 112 0.257 17 170 2 Hr, 50 min 10 89 0.628 42 420 7 Hr, 00 min 10 103 0.231 18 180 3 Hr, 00 min 10 93 0.993 43 430 7 Hr, 10 min 10 99 0.193 19 190 3 Hr, 10 min 10 96 1.37 44 440 7 Hr, 20 min 10 95 0.172 20 200 3 Hr, 20 min 10 98 1.89 45 450 7 Hr, 30 min 10 92 0.167 21 210 3 Hr, 30 min 10 100 2.53 46 460 7 Hr, 40 min 10 97 0.149 22 220 3 Hr, 40 min 10 98 3.05 47 470 7 Hr, 50 min 10 103 0.138 23 230 3 Hr, 50 min 10 101 3.46 48 480 8 Hr, 00 min 10 102 0.130 24 240 4 Hr, 00 min 10 104 3.71 49 490 8 Hr, 10 min 10 103 0.123
Slug-Dose Curve 4.0 3.5 Tracer Concentration, mg/L 3.0 2.5 2.0 1.5 1.0 0.5 0.0 0 50 100 150 200 250 Time, minutes 300 350 400 450 500 550 Modal Contact Time: 240 min; HRT: 240 min
Slug-Dose Normalized to F-Curve 1.0 0.9 Normalize Tracer Concentration 0.8 0.7 0.6 0.5 0.4 0.3 0.2 0.1 0.0 0.0 0.2 0.4 0.6 0.8 1.0 1.2 t/HRT 1.4 1.6 1.8 2.0 2.2 2.4
Overall Results 1. Test Date: May 15, 2017 No pipeline mixing Modal Baffling Factor: 0.24 2. Test Date: July 20, 2017 No pipeline mixing Modal Baffling Factor: 0.18 3. Test Date: August 9, 2017 Added pipeline mixing in Manhole C/pipeline Modal Baffling Factor: 0.62 4. Test Date: October 28, 2021 Added second pipeline mixing in Manhole B/pipeline Modal Baffling Factor: 1.0


")


![[Insert Study Name] Study Webinar: Engaging Participants for Research Progress](/thumb/168084/insert-study-name-study-webinar-engaging-participants-for-research-progress.jpg)