Tracer Study Summary at Cement Hill Water Treatment Plant
A tracer study was conducted at the Cement Hill Water Treatment Plant in CA to analyze the flow of liquid fluoride through the pipeline and storage tanks. The study involved injecting liquid fluoride into the transmission pipe post-filtration and measuring doses at different stations along the pipeline. Findings included varying tank exit flows, sampling at three stations, and key data on flow rates, volumes, and baffling factors.

Download Presentation

Please find below an Image/Link to download the presentation.
The content on the website is provided AS IS for your information and personal use only. It may not be sold, licensed, or shared on other websites without obtaining consent from the author. Download presentation by click this link. If you encounter any issues during the download, it is possible that the publisher has removed the file from their server.
E N D
Presentation Transcript
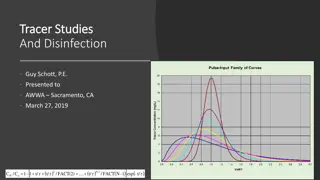
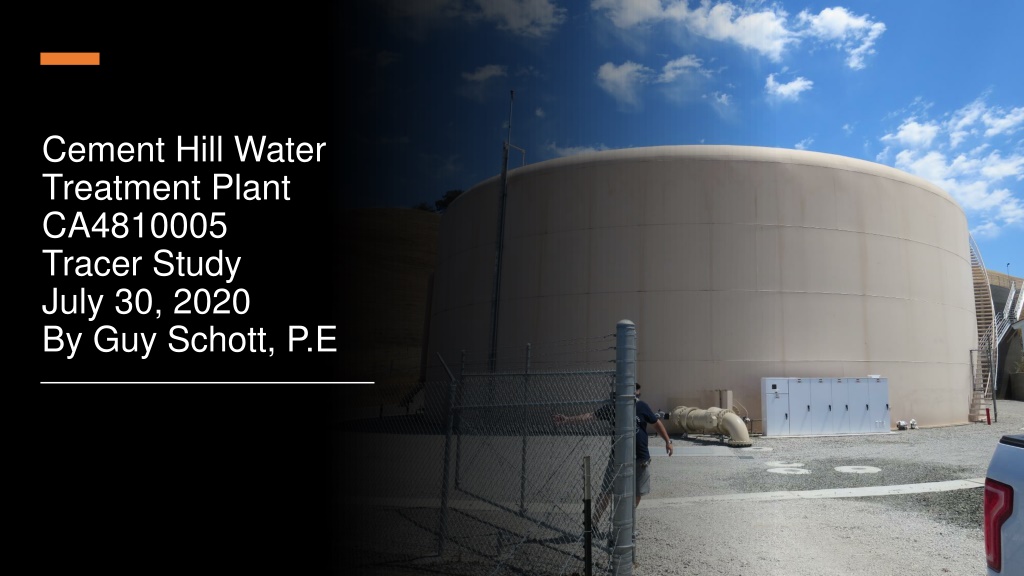
Cement Hill Water Treatment Plant CA4810005 Tracer Study July 30, 2020 By Guy Schott, P.E
Table of Contents Clearwell Design Specifications and Tracer Sampling Points Summary of Tracer Results and Procedures Tracer Injection Point Recorded Tracer Data (Tables) Graphs: Modified Step-Dose Curves for Stations 2 and 3 Graphs: Normalized Modified Step-Dose Curve to F-Curve for Stations 2 & 3 Purpose of a Tracer Test Disinfection Exposure Time of Fluid in Vessel for Determining Ct10 Ct10Value Baffling Factor (BF), Definition Tracer Test Method (Modified Step-Dose) Method of Analysis and Equipment
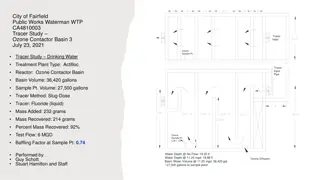
Pipeline & Tank Design Specifications Has Floating Spray Aeration (TTHMs) (water is recirculated from top) Tank 2A (Steel) Tank 2B (Concrete) Diameter: 100-ft Volume: 2.0 MG Diameter: 100-ft Volume: 2.0 MG PAX Mixer PAX Mixer Tracer Station 2 Outlet 20-in Inlet 20-in Tracer Station 1 Outlet 20-in Inlet 20-in Tracer Station 3 3,189-ft Transmission line, 20-in Dia.
Summary of Tracer Procedures Tracer study was conducted on a 3,189 linear feet, 20-in diameter transmission and two 2.0 MG storage tanks all operated in series. Liquid fluoride was used as the tracer and was injected into a 20-in pipeline downstream of filtration. Sampling were done at three stations Station 1: End of 3,189 linear feet transmission line to determine fluoride dose (mg/L) Station 2: Outlet of 2.0 MG Steel Tank Station 3: Outlet of 2.0 MG Concrete Tank Pipeline flow was 3,000 gpm (steady-state) Tanks exit flows varied from 2,200 2,400 gpm
Cement Hill Water Treatment Plant Tracer and Fluoride injection location Tracer: H2SiF6, Fluoride (F) Feed pump rate: 100 mL/min Background: 0.081 mg/L as F Measured dose: 2.1 mg/L as F (excluding background fluoride) Fluoride (tracer) was injected into a 20-in diameter transmission pipe (post filtration). The transmission line is 3,189 linear feet to the CT storage tanks.
Tracer Test Result Summary Transmission Line + 2.0 MG Steel Tank Volume of Transmission Line + Tank: 1,310,370 gallons (avg) Steel Tank Outlet Flow: 2,390 gpm (avg) HRT: 548 minutes (1,310,370 gal/2,390 gpm) t10: 38 minutes Baffling Factor (t10/HRT): 0.07 Modified Step-Dose Test Date: 7/30/20 Transmission Line: 3,189 feet (20-in Dia) Transmission Line Vol: 52,044 gallons Transmission Flow: 3,000 gpm Tank Operating Level: 21.2 - 21.6 ft Tank Working Vol: 1,258,326 gallons (avg)
Tracer Test Result Summary Transmission Line + 2.0 MG Steel + 2.0 MG Concrete Tanks Volume of Transmission Line + Tanks: 2,635,651 gallons (avg) Concrete Tank Outlet Flow: 2,214 gpm (avg) HRT: 1,183 minutes (2,635,651 gal/2,214 gpm) t10: 270 minutes (4.5 hours) Baffling Factor (t10/HRT): 0.23 Modified Step-Dose Test Date: 7/30/20 Transmission Line: 3,189 feet (20-in Dia) Transmission Line Vol: 52,044 gallons Transmission Flow: 3,000 gpm Tank Operating Level: 21.2 - 22.7 ft Combined Tanks Working Vol: 2,583,606 gallons (avg)
Station 1: Transmission Line to 2.0 MG Steel Tank First segment is 3,189 linear feet of 20-inch diameter transmission line to 2 MG Steel tank. Tracer dose (Fluoride) is measured and verify as it enters the first CT storage tank.
Station 2: 2.0 MG Steel Tank Sample station on exit side of 2.0 MG Steel Tank. This water exits the tank and flows to the bottom of the 2.0 MG Concrete Tank. Baffling Factor (t10/HRT): 0.07 (Pipeline + 2.0 MG Steel Tank) operated in series
Station 3: 2.0 MG Concrete Tank Sample station on exit side of 2.0 MG Concrete Tank. Baffling Factor (t10/HRT): 0.23 (Pipeline + 2.0 MG Steel Tank + 2.0 MG Concrete Tank) operated in series
Tracer Fluoride Pipeline Station 1, Table 1 Elapsed Time minutes 0 Elapsed Time minutes 8 Elapsed Time minutes 16 Tracer Fluoride mg/L 0.0841 Tracer Fluoride mg/L 0.0795 Tracer Fluoride mg/L 0.0795 1 0.0822 9 0.0800 17 0.0779 2 0.0824 10 0.0874 18 0.0786 3 0.0798 11 0.0837 19 0.0791 4 0.0816 12 0.0854 20 0.0928 5 0.0799 13 0.0786 21 1.26 6 0.0785 14 0.0783 25 1.98 7 0.0802 15 0.0784 30 2.09
Tracer Fluoride Pipeline Station 1, Table 2 Elapsed Time minutes 40 Elapsed Time minutes 80 Elapsed Time minutes 140 Tracer Fluoride mg/L 2.13 Tracer Fluoride mg/L 2.18 Tracer Fluoride mg/L 2.19 45 2.17 90 2.16 150 2.18 50 2.17 100 2.17 160 2.15 55 2.19 110 2.16 170 2.16 60 2.19 120 2.18 180 2.17 70 2.20 130 2.19 190 2.20
Tracer Dose and Background Residual Average background fluoride concentration: 0.081 mg/L as F Average steady-state measured fluoride concentration exiting pipeline and entering the first tank (steel): 2.179 mg/L as F Fluoride dose: 2.179 0.081 = 2.10 mg/L as F Results are based on tracer dose of 2.10 mg/L as F 10% of tracer dose is 0.210 mg/L as F
Tracer Fluoride Steel Tank Station 2, Table 1 Elapsed Time minutes t/HRT Tracer Fluoride mg/L Elapsed Time minutes t/HRT Tracer Fluoride mg/L 3 6 9 0.005 0.011 0.016 0.022 0.027 0.033 0.038 0.0 0.0 0.0 0.0 0.0 0.0 0.0 24 27 30 33 36 39 42 0.044 0.049 0.055 0.060 0.065 0.071 0.076 0.007 0.1343 0.1783 0.1833 0.1683 0.2501 0.2313 12 15 18 21
Tracer Fluoride Concrete Tank Station 3, Table 1 Elapsed Time minutes t/HRT Tracer Fluoride mg/L Elapsed Time minutes t/HRT Tracer Fluoride mg/L 10 30 50 70 80 90 100 0.009 0.026 0.043 0.061 0.069 0.078 0.086 0.000 0.000 0.008 0.016 0.020 0.028 0.033 110 120 126 132 138 144 150 0.095 0.104 0.109 0.114 0.119 0.124 0.129 0.041 0.049 0.052 0.057 0.065 0.072 0.073
Tracer Fluoride Concrete Tank Station 3, Table 2 Elapsed Time Minutes t/HRT Tracer Fluoride mg/L Elapsed Time minutes t/HRT Tracer Fluoride mg/L 156 162 168 174 180 186 0.134 0.139 0.144 0.149 0.154 0.159 0.081 0.088 0.087 0.093 0.101 0.109 198 204 210 216 222 228 0.169 0.174 0.179 0.184 0.189 0.194 0.119 0.127 0.133 0.142 0.150 0.156
Tracer Fluoride Concrete Tank Station 3, Table 3 Elapsed Time Minutes t/HRT Tracer Fluoride mg/L Elapsed Time minutes t/HRT Tracer Fluoride mg/L 240 246 252 258 264 270 0.204 0.209 0.214 0.219 0.223 0.228 0.170 0.180 0.188 0.194 0.200 0.209 276 282 288 294 300 306 0.233 0.238 0.243 0.248 0.253 0.257 0.216 0.222 0.231 0.236 0.244 0.251
Step-Dose Curve 20-in Dia. Transmission Line (3,189 ft) Step-Dose Curve (Pipeline) 2.2 2.0 Tracer Concentration (mg/L) 1.8 1.6 1.4 1.2 1.0 0.8 0.6 0.4 0.2 0.0 0 20 40 60 80 100 120 140 160 180 200 Time (minutes)
Step-Dose Curve Transmission Line + 2.0 MG Steel Tank Step-Dose Curve (Pipeline + Steel Tank) 0.30 Dose: 2.1 mg/L 0.21 mg/L at t10 t10: 38 min HRT: 548 min Tracer Concentration (mg/L) 0.25 0.20 0.15 0.10 t10/HRT = 0.07 0.05 0.00 0 2 4 6 8 10 12 14 16 18 20 22 24 26 28 30 32 34 36 38 40 42 44 Time (minutes)
Normalized to F-Curve Transmission Line + 2.0 MG Steel Tank Normalized F-Curve (Pipeline + Steel Tank) 0.14 0.12 Tracer Normalized 0.10 0.08 0.06 0.04 Baffling Factor (BF) = 0.07 0.02 0.00 0.00 0.01 0.02 0.03 0.04 t/HRT 0.05 0.06 0.07 0.08
Step-Dose Curve: Transmission Line + 2.0 MG Steel + 2.0 MG Concrete Tanks Step-Dose Curve (Pipeline + Steel Tank + Concrete Tank) 0.30 Dose: 2.1 mg/L 0.21 mg/L at t10 t10: 270 min HRT: 1,183 min Tracer Concentration (mg/L) 0.25 0.20 0.15 0.10 t10/HRT = 0.23 0.05 0.00 0 25 50 75 100 125 150 175 200 225 250 275 300 Time (minutes)
Normalized to F-Curve : Transmission Line + 2.0 MG Steel + 2.0 MG Concrete Tanks Normalized F-Curve (Pipeline + Steel Tank + Concrete Tank) 0.14 Normalized Concentration 0.12 0.10 0.08 0.06 Baffling Factor (BF) = 0.23 0.04 0.02 0.00 0.00 0.02 0.04 0.06 0.08 0.10 0.12 0.14 0.16 0.18 0.20 0.22 0.24 0.26 t/HRT
Purpose of a Tracer Study To determine the hydraulic efficiency or disinfectant exposure time of water through one or more reactors. The addition of known quantities of a nonreactive chemical (tracer) is added in the form of a pulse (slug) or step-input. The time of travel or disinfectant exposure time through the reactor is related to: Flow rate Reactor water volume Water Depth Reactor configuration Hydraulic mixing
Disinfection Exposure Time of Fluid in Vessel for Determining Ct10 C is the disinfectant residual (mg/L) at the point of inactivation compliance. The disinfection exposure time of water used for Ct10 calculation is the time (t10) it takes for the first 10 percent of the water entering the reactor to exit the reactor. To determine this, a marker (nonreactive tracer) is introduced into the water and is monitored leaving the reactor. Example: 2.7 mg/L of tracer is continuously dose during testing; t10 is that time when 0.27 mg/L of tracer concentration (10% of dose) has exit the reactor.
Ct10 Value Log inactivation is based on the Delivered Dose, Ct10 C is the disinfectant residual (mg/L) t10 is the exposure or contact time (minutes) Multiply them: C t10= mg/L min (delivered dose) The calculated Ct10 value is looked up in EPA Cttables to determine the log inactivation based on specific monitoring parameters (pH, disinfectant residual and temperature).
Baffling Factor (BF) Baffling factor or short-circuiting factor: Determined from tracer study or estimated BF = t10/ HRT from tracer study HRT (hydraulic residence time) = reactor volume divided by reactor flow Once the BF is determined, then it is applied to the operations of the reactor for determining the disinfectant exposure time. Example: Total Clearwell operating volume: 2,600,000 gallons Exit flow: 2,500 gpm (3.6 MGD) BF: 0.23, from tracer study Calculated contact or disinfection exposure time: 2,600,000 gal 2,500 gpm 0.23 = 239 minutes = t10
Test Method Modified Step-Dose Method It is a continue feed of tracer at constant rate and inlet plant flow throughout the duration of the test. The Step-Dose test has a duration of 3-4 HRT to achieve reactor outlet steady-state tracer concentration. The time t10 is determined when 10% of the tracer dose concentration has exist the reactor. The Modified Step-Dose test allows the test to be completed in less than 1 HRT by physical measurements of the tracer inlet flow and/or channel basin concentration.
Method of Analysis and Equipment Intellical Selective Electrode (ISE) HQ40d Portable ISE Multi-Parameter Meter Fluoride Ionic Strength Adjustor (ISA) Fluoride Standards (0.2/2.0 & 0.5/ 5.0 mg/L) 25 mL graduated cylinder Finnpipette F2 variable volume pipette, capacity 0.5 - 5 mL Electrode stirrer stand 50 mL beakers Stir Bar, Magnetic, Polygon ISEF121 Fluoride (F-) Ion
Contact Guy Schott, P.E. State Water Resources Control Board Division of Drinking Water Santa Rosa, CA Go to Tracer Test Results for review www.waterboards.ca.gov/drinking_water/programs/districts/mendocino_district.html Email: Guy Schott - Guy.Schott@waterboards.ca.gov Office Number: 707-576-2732


")