Understanding Tracer Studies and Disinfection in Water Treatment


T
r
a
c
e
r
S
t
u
d
i
e
s
A
n
d
D
i
s
i
n
f
e
c
t
i
o
n

•
Guy Schott, P.E.
•
Presented to
•
AWWA – Sacramento, CA
•
March 27, 2019


Learning Objectives

1.
Purpose of a tracer study
2.
Water age distribution
3.
Disinfection exposure time
4.
CT disinfection (pathogen delivered dose)
5.
Log inactivation
6.
Baffling Factor (BF)
7.
Tracer test preparation
8.
Hydraulic efficiencies for different reactors
9.
Discussion
Purpose of a
Tracer Study
To determine the hydraulic or disinfectant
exposure time of water through one or
more reactors.
Performed by the addition of a
nonreactive chemical (tracer, marker).
60% of water age is 100 min or more
90% of water age is 62 min or more
10%
40%
Disinfection
Exposure Time (t
10
)
Based on the time it takes for 10% of the
total water entering a reactor to be the
first to exit the reactor. Determined via
tracer study.
Disinfectant
Exposure Time
Related to:
•
Reactor configuration
(inlet/outlet, baffles, L:W)
•
Water Depth
•
Working volume
•
Flow rate
•
Temperature gradient
•
Hydraulic mixing
Delivered Dose
to Pathogen
(Ct)
Delivered Dose, “
Ct
”
“
C
” is the disinfectant residual (mg/L)
“
t
” is the disinfectant exposure or
contact time (minutes)
C
x
t
= mg/L * min, delivered dose
Cl
2
Cl
2
Cl
2
Cl
2
Cl
2
Disinfection
Log Inactivation
Giardia
cyst
log inactivation is based on the
Delivered Dose, “
Ct
” and associated
•
pH
•
Disinfectant residual
•
Temperature
Virus
log inactivation is based on the
Delivered Dose, “
Ct
” and associated
•
Disinfectant residual
•
Temperature
Parameters are looked up in EPA
Ct
tables to
determine the log inactivation.
Baffling
Factor (BF)
Generated from Tracer Study:
•
t
10
= disinfectant exposure time
•
HRT
= hydraulic residence time =
Volume/flow
•
Baffling Factor (BF) =
t
10
/ HRT
•
0 < BF
< 1
•
BF
is applied to the disinfection contact
basin’s operational HRT to determine
contact time (t
10
, minutes).
Calculated daily treatment plant
disinfectant exposure time:
•
t
10_cal
= BF x HRT
Tracer Test Preparation
1.
Reactor Process to Evaluate
2.
Tracer methods
3.
Tracer material
4.
Tracer dosage
5.
Test flows and reactor operating level
6.
Test duration
7.
Chemical feed pump
8.
Sample locations
9.
Sample frequency
10.
Communication between parties involved
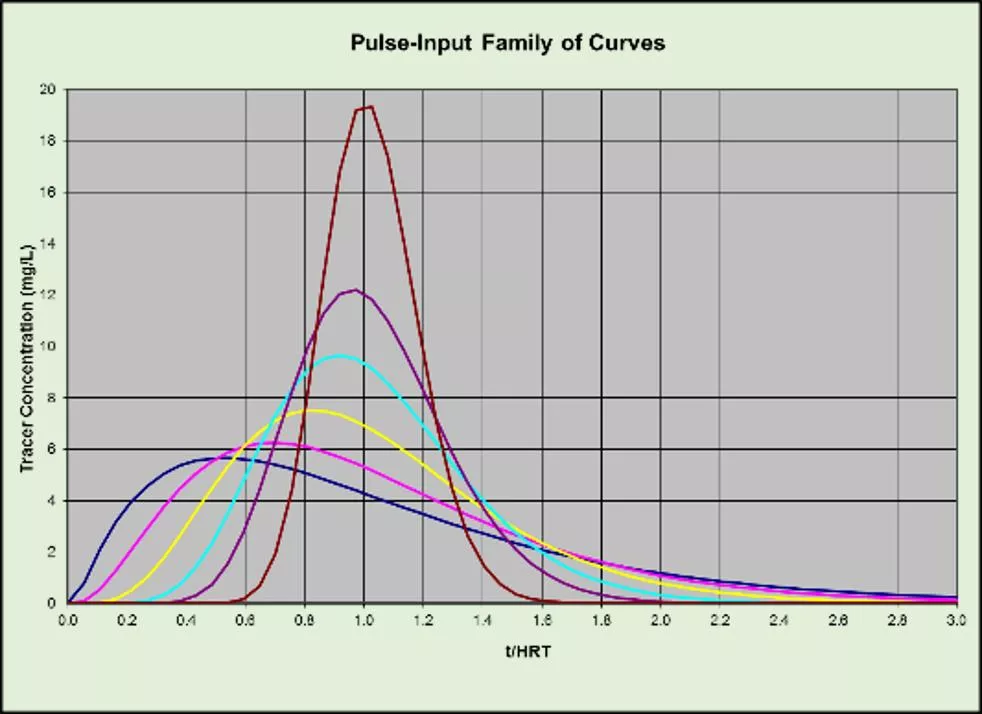
1. Tracer Methods
A continuous tracer feed added throughout test.
Adding the entire amount of tracer at the beginning of test.
Step-Dose Method
•
A continuous tracer feed
added throughout test.
Tracer Test
Methods
Slug-Dose Method
•
Adding the entire amount
of tracer at the beginning
of test.
Model Step-Dose Curve
Model Slug-Dose Curve
Actual Slug-Dose Curve
2. Tracer Material
•
Fluoride (F)
•
Liquid (
H
2
SiF
6
Hydrofluorosilicic
Acid)
•
Dry (NaF)
•
15 gal NaF mix solution :
1 gal
H
2
SiF
6
•
Lithium Chloride (Li)
•
Others (NaCl, CaCl
2
), dry or liquid
Tracer should be non-reactive
3. Dosage
Step-Dose
•
Fluoride: 2 to 4.0 mg/L as F
•
Lithium: 0.5 mg/L
•
Chloride/Na/Ca: Dependent on
background constituents and any
secondary standards
Slug-Dose Test
How Much Tracer
to Add
1.
Estimate BF
2.
Calculate amount of
tracer mass needed for
associated dispersion
concentration.
3.
For lower or higher
peak concentration,
apply factor to
dispersion
concentration.
.
4A. Test Flows and
Operating Level
•
One Test: Normal operating flow and
clearwell level.
•
Two Tests: Summer/winter flows and
clearwell levels.
•
Three Tests: High/mid/low flows and
normal operating clearwell levels.
4B. Test Flows and
Operating Level
•
Baffle tanks –
•
Higher flow, results in greater mixing
(>Reynolds number & BF)
•
At a given flow, increase tank volume
(<Reynolds number & BF)
•
Non-baffled tanks -
•
Less predicable
•
Temperature gradient can result in less
mixing (<BF), greater short-circuiting.
•
At a given flow, increase/decrease in
tank volume (? Increase/decrease in BF)
5A. Test Duration
•
May vary from < 1 HRT to 4 HRT (site
specific & predicted BF)
•
For full tracer recovery (slug-dose) and
steady-state tracer (step-dose)
•
2.5 - 4 HRT duration
5B. Test Duration -
When HRT is very long
•
Modified the Step-Dose method
•
Test is completed in less than 1 HRT
•
Measurements of tracer inlet and outlet
•
Inlet measurements:
•
Flow into 5-gallon bucket over several
minutes to ensure average applied tracer
dosage is measured. Take sample out of
bucket.
•
Dump bucket and start over with next
sample
•
Average inlet sample results to determine
applied dosage
•
Outlet measurements:
•
Sample duration < HRT
Modified Step-Dose Method
Inlet
Sampling
Outlet
Sampling
All sampling is conducted to 1 x HRT or less
Tracer
Actual Modified Step-Dose Test Curve
6. Chemical Feed
Pump
•
Select chemical feed pump capacity based
on plant flow and mL/min dosage range.
•
Before tracer test, prime and test feed
pump to ensure it works and stays on
during duration of test.
•
For slug-dose test, may be appropriate to
temporarily shut down treatment plant for
2-5 minutes to inject tracer material and
then start plant (site-specific).
7. Sample Frequency
•
Sample distribution frequency is depended
on baffling factor resolution goal around
critical sampling region.
•
Example:
•
Goal – e.g., measure to the nearest
0.02
baffling factor (BF).
1.
HRT = 150 minutes
•
Sample Frequency Critical Region
0.02
•
HRT = 0.02
•
150 min =
3
minutes
•
Critical region – is the area under curve
where t
10
occurs for a Step-Dose curve.
8. Sample Locations
•
Reactor outlet
•
Modified Step-Dose, inlet/outlet
•
Use 5 gallon bucket for inlet
sampling to obtain average inlet
tracer dosage
•
Take sample out of bucket
•
Dump bucket and start over
9. Communications
•
Plant personnel
•
Regulatory agency
•
Firm doing the tracer study
•
By phone, email and/or written report
When flows are not
at steady-state
•
Variable outlet flow
•
Modified step-dose method
•
Take cumulative treated water volume (V
10
,
gallons) from time zero (t
o
) to t
10
•
Divide cumulative volume (V
10
) by average
working volume (V
10
/V) = BF
•
BF= V
10
/V
from tracer test (based on volume)
•
V
10
: The volume of water that has exited
the reactor from t
o
to t
10
when 10% of the
tracer mass has exited the reactor.
•
V
: Average operating Clearwell volume of
water during tracer test from t
o
to t
10
.
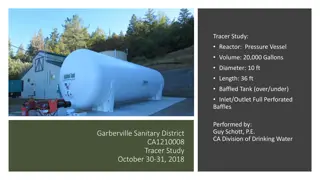
Reactors – Chlorine Contactors
Circular
Tanks
Rectangular Tanks,
Serpentine Flow
Top View
BF (0.05-0.2)
BF (0.3-0.4), L:W = 12
BF (0.4-0.45), L:W = 16
BF (0.6-0.7), L:W = 52
BF is depended on reactor design, volume, water depth, flow and temperature gradient
L:W is the total travel length of water divided by channel width or pipe diameter.
Determining L:W ratio
Length
is longest flow
path (red line).
Width
is the average
channel width for
each flow path.
Determining L:W ratio
Length
is longest flow
path (red line).
Width
is the average
channel width for
each flow path.
Contact
Guy Schott, P.E.
State Water Resources Control Board
Division of Drinking Water
Santa Rosa, CA
For Tracer Study Database and/or Results:
•
https://www.waterboards.ca.gov/drinking_
water/programs/districts/mendocino_distri
ct.html
•
Guy.Schott@waterboards.ca.gov
•
707-576-2732
Tracer studies play a crucial role in determining hydraulic efficiencies and disinfectant exposure times in water treatment processes. This presentation by Guy Schott covers the purpose of tracer studies, water age distribution, disinfection exposure time, CT disinfection, log inactivation, and more. Learn about the importance of reactor configuration, delivered dose to pathogens, log inactivation parameters, and how tracer studies help in optimizing water treatment processes.

Download Presentation

Please find below an Image/Link to download the presentation.
The content on the website is provided AS IS for your information and personal use only. It may not be sold, licensed, or shared on other websites without obtaining consent from the author. Download presentation by click this link. If you encounter any issues during the download, it is possible that the publisher has removed the file from their server.
E N D
Presentation Transcript
Tracer Studies Tracer Studies And Disinfection Guy Schott, P.E. Presented to AWWA Sacramento, CA March 27, 2019 ( ) ( ) ( ) ( ) 2 N 1 - 1 - 1 = + + .... + + C / C t/ t/ / FACT(2) t/ / FACT N 1 - exp - t/ N o
Learning Objectives 1. 2. 3. 4. 5. 6. 7. 8. 9. Purpose of a tracer study Water age distribution Disinfection exposure time CT disinfection (pathogen delivered dose) Log inactivation Baffling Factor (BF) Tracer test preparation Hydraulic efficiencies for different reactors Discussion
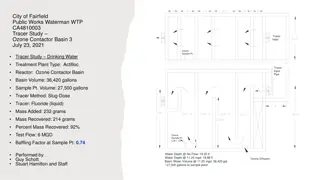
To determine the hydraulic or disinfectant exposure time of water through one or more reactors. Purpose of a Tracer Study Performed by the addition of a nonreactive chemical (tracer, marker).
40% 60% of water age is 100 min or more 10% 90% of water age is 62 min or more
Based on the time it takes for 10% of the total water entering a reactor to be the first to exit the reactor. Determined via tracer study. Disinfection Exposure Time (t10)
Related to: Reactor configuration (inlet/outlet, baffles, L:W) Water Depth Working volume Flow rate Temperature gradient Hydraulic mixing Disinfectant Exposure Time
Cl2 Cl2 Cl2 Delivered Dose, Ct Cl2 Cl2 C is the disinfectant residual (mg/L) t is the disinfectant exposure or contact time (minutes) Delivered Dose to Pathogen (Ct) C x t= mg/L * min, delivered dose
Giardia cyst log inactivation is based on the Delivered Dose, Ct and associated pH Disinfectant residual Temperature Viruslog inactivation is based on the Delivered Dose, Ct and associated Disinfectant residual Temperature Disinfection Log Inactivation Parameters are looked up in EPA Ct tables to determine the log inactivation.
Generated from Tracer Study: t10= disinfectant exposure time HRT= hydraulic residence time = Volume/flow Baffling Factor (BF) = t10 / HRT 0 < BF< 1 BF is applied to the disinfection contact basin s operational HRT to determine contact time (t10, minutes). Calculated daily treatment plant disinfectant exposure time: t10_cal = BF x HRT Baffling Factor (BF)
Tracer Test Preparation 1. Reactor Process to Evaluate 2. Tracer methods 3. Tracer material 4. Tracer dosage 5. Test flows and reactor operating level 6. Test duration 7. Chemical feed pump 8. Sample locations 9. Sample frequency 10. Communication between parties involved
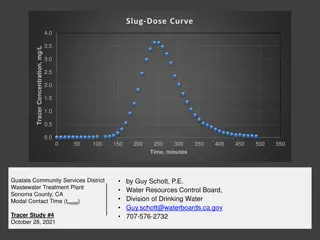
1. Tracer Methods Step-Dose Curve Slug-Dose Curve 1.0 2.0 0.9 1.8 0.8 1.6 TRACER CONCENTRATION 0.7 1.4 0.6 1.2 C/Co 0.5 1.0 0.4 0.8 0.3 0.6 0.2 0.4 0.1 0.2 0.0 0.0 0.0 0.3 0.6 0.9 1.2 1.5 1.8 2.1 2.4 2.7 3.0 0.0 0.3 0.6 0.9 1.2 1.5 t/HRT 1.8 2.1 2.4 2.7 3.0 t/HRT Adding the entire amount of tracer at the beginning of test. A continuous tracer feed added throughout test.
Step-Dose Method A continuous tracer feed added throughout test. Slug-Dose Method Adding the entire amount of tracer at the beginning of test. Tracer Test Methods Tracer Q1 Cl2 Cl2 Q2 ti .. Tracer Chlorine Contact Basin
Model Step-Dose Curve Step-Dose Curve 1.0 0.9 0.8 0.7 0.6 C/CO 0.5 0.4 0.3 0.2 0.1 0.0 0.0 0.2 0.4 0.6 0.8 1.0 1.2 1.4 1.6 1.8 2.0 2.2 2.4 2.6 2.8 3.0 t/HRT
Model Slug-Dose Curve Slug-Dose Curve 2.0 1.8 Tracer Concentration 1.6 1.4 1.2 1.0 0.8 0.6 0.4 0.2 0.0 0.0 0.2 0.4 0.6 0.8 1.0 1.2 1.4 1.6 1.8 2.0 2.2 2.4 2.6 2.8 3.0 t/HRT
Actual Slug-Dose Curve Slug-Dose Curve 2.0 1.8 Tracer Concentration 1.6 1.4 1.2 1.0 0.8 0.6 0.4 0.2 0.0 0.0 0.2 0.4 0.6 0.8 1.0 1.2 1.4 1.6 1.8 2.0 2.2 2.4 2.6 2.8 3.0 t/HRT
Fluoride (F) Liquid (H2SiF6 Hydrofluorosilicic Acid) Dry (NaF) 15 gal NaF mix solution : 1 gal H2SiF6 Lithium Chloride (Li) Others (NaCl, CaCl2), dry or liquid 2. Tracer Material Tracer should be non-reactive
Step-Dose Fluoride: 2 to 4.0 mg/L as F Lithium: 0.5 mg/L Chloride/Na/Ca: Dependent on background constituents and any secondary standards 3. Dosage
Slug-Dose Test How Much Tracer to Add Calculated Dispersion Concentration in Basin Tracer Study Peak Concentration (estimated) t10/HRT (BF) 0.24 1.35 1.0 1. 2. Estimate BF Calculate amount of tracer mass needed for associated dispersion concentration. For lower or higher peak concentration, apply factor to dispersion concentration. 0.34 1.23 1.0 0.42 1.12 1.0 3. 0.51 0.95 1.0 0.61 0.76 1.0 0.70 0.58 1.0 .
One Test: Normal operating flow and clearwell level. Two Tests: Summer/winter flows and clearwell levels. Three Tests: High/mid/low flows and normal operating clearwell levels. 4A. Test Flows and Operating Level
Baffle tanks Higher flow, results in greater mixing (>Reynolds number & BF) At a given flow, increase tank volume (<Reynolds number & BF) Non-baffled tanks - Less predicable Temperature gradient can result in less mixing (<BF), greater short-circuiting. At a given flow, increase/decrease in tank volume (? Increase/decrease in BF) 4B. Test Flows and Operating Level
May vary from < 1 HRT to 4 HRT (site specific & predicted BF) 5A. Test Duration For full tracer recovery (slug-dose) and steady-state tracer (step-dose) 2.5 - 4 HRT duration
Modified the Step-Dose method Test is completed in less than 1 HRT Measurements of tracer inlet and outlet Inlet measurements: Flow into 5-gallon bucket over several minutes to ensure average applied tracer dosage is measured. Take sample out of bucket. Dump bucket and start over with next sample Average inlet sample results to determine applied dosage Outlet measurements: Sample duration < HRT 5B. Test Duration - When HRT is very long
Modified Step-Dose Method Clearwell Inlet Sampling Outlet Sampling Tracer All sampling is conducted to 1 x HRT or less
Actual Modified Step-Dose Test Curve Step-Dose Curve 0.16 0.14 0.12 0.10 C/Co 0.08 0.06 0.04 0.02 0.00 0.00 0.03 0.06 0.09 0.12 0.15 0.18 0.21 0.24 0.27 0.30 0.33 0.36 0.39 0.42 0.45 0.48 0.51 0.54 t/HRT
Select chemical feed pump capacity based on plant flow and mL/min dosage range. Before tracer test, prime and test feed pump to ensure it works and stays on during duration of test. For slug-dose test, may be appropriate to temporarily shut down treatment plant for 2-5 minutes to inject tracer material and then start plant (site-specific). 6. Chemical Feed Pump
Sample distribution frequency is depended on baffling factor resolution goal around critical sampling region. Example: Goal e.g., measure to the nearest 0.02 baffling factor (BF). 1. HRT = 150 minutes Sample Frequency Critical Region 0.02 HRT = 0.02 150 min = 3 minutes Critical region is the area under curve where t10 occurs for a Step-Dose curve. 7. Sample Frequency
Reactor outlet Modified Step-Dose, inlet/outlet Use 5 gallon bucket for inlet sampling to obtain average inlet tracer dosage Take sample out of bucket Dump bucket and start over 8. Sample Locations
Plant personnel Regulatory agency Firm doing the tracer study By phone, email and/or written report 9. Communications
Variable outlet flow Modified step-dose method Take cumulative treated water volume (V10, gallons) from time zero (to) to t10 Divide cumulative volume (V10) by average working volume (V10/V) = BF When flows are not at steady-state BF= V10/V from tracer test (based on volume) V10: The volume of water that has exited the reactor from to to t10 when 10% of the tracer mass has exited the reactor. V: Average operating Clearwell volume of water during tracer test from to to t10.
Reactors Chlorine Contactors Top View BF (0.05-0.2) BF (0.3-0.4), L:W = 12 Circular Tanks BF (0.4-0.45), L:W = 16 BF (0.6-0.7), L:W = 52 Rectangular Tanks, Serpentine Flow BF is depended on reactor design, volume, water depth, flow and temperature gradient L:W is the total travel length of water divided by channel width or pipe diameter.
Determining L:W ratio Inlet Length is longest flow path (red line). Width is the average channel width for each flow path. Outlet
Determining L:W ratio Inlet Length is longest flow path (red line). Width is the average channel width for each flow path. Outlet
Length-to-Width Ratios vs. t10/HRT Baffled Tanks 1.0 0.9 0.8 0.7 0.6 t10/HRT 0.5 0.4 0.3 0.2 0.1 0.0 0 5 10 15 20 25 30 35 40 45 50 55 60 65 70 75 80 85 90 L/W AWWARF - Rectangular Clearwells SWRCB - Rectangular Clearwells SWRCB - Rectangular & Circular Clearwells SWRCB - Circular Clearwells
Contact Guy Schott, P.E. State Water Resources Control Board Division of Drinking Water Santa Rosa, CA For Tracer Study Database and/or Results: https://www.waterboards.ca.gov/drinking_ water/programs/districts/mendocino_distri ct.html Guy.Schott@waterboards.ca.gov 707-576-2732


")