ERCOT Cone Study Draft Overview


MAY 24, 2024
PREPARED FOR
ERCOT
PREPARED BY
The Brattle Group
Sam Newell
Andrew W. Thompson
Rohan Janakiraman
Sargent & Lundy
Sang Gang
Joshua Jungé
Hyojin Lee
Preksha Nair
ERCOT CONE Study Draft


brattle.com | 1
Executive Summary
Bottom-up Costs for Reference and Alternative Technology
Draft CONE Results
Project Timeline and Next Steps
Agenda


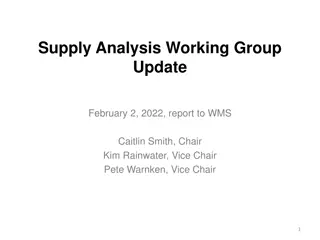
1. Executive Summary

brattle.com | 3
Overview of CONE approach

1. Choose reference
technology characteristics

2. Conduct bottom-up
cost analysis

3. Calculate Cost of New
Entry (CONE)

Presented at March 22
nd
, 2024
SAWG meeting
Longstanding “Revealed
Preference” method led to:
Reference Technology
Aeroderivative LM6000 plant
with 291 MW (at ISO
conditions) in Harris County
Alternative Technology
Solar PV + BESS Hybrid with
200 MW PV + 100 MW 2-hr
BESS in Brazoria County
Will be presented in this meeting
Cost Estimates
Bottom-up estimates of Capital
and O&M costs as of April 2024
Then costs escalated to the mid-
point construction period
Will be presented in this meeting
CONE represents the first-year revenues
a resource would need to earn to enter,
given its costs, its projected future net
revenue trajectory, and its cost of capital
CONE Calculation
Determine levelization “shape” (e.g.,
level-nominal) and lifetime
Develop ATWACC
Calculate first-year revenue
requirement for NPV=0 in
CONE spreadsheet model
(accounts
for taxes w/depreciation, etc.)

1. EXECUTIVE SUMMARY
brattle.com | 4
Summary of CONE Estimates for Reference Plants with COD June 2026
CONE Estimate for 291 MW (at ISO cond.) 6x0 LM6000
1. EXECUTIVE SUMMARY
CONE Estimate for 200 MW PV w/100 MW 2-hr BESS
Definitions
“Overnight cost” is the cost of all the inputs on a certain
date (in our analysis, based on April 2024 cost rates and
escalated to the middle of the construction period and
expressed in nominal$.
“Capital charge rate” is defined such that CONE = overnight
cost × capital charge rate + levelized FOM.
Comparisons to some benchmarks
Cost of LM6000 plant is comparable to EIA’s latest.
CONE of LM6000 is much higher than in PJM 2022 study
($190/kW-yr CC and $151/kW-yr Frame CT) because aeros
cost more per kW and because ATWACC is 150 bp higher
Alt tech has lower CONE and greater net E&AS revenues but
serves a different purpose in the market.
The range reflects inherent differences and uncertainties.
Notes: Both calculations use 10.35% ATWACC. The aero has a higher capital charge rate
because of a longer construction period (incurring cost of capital) and longer depreciation.
The CONE estimate for the hybrid is expressed as cost per kW of just the PV capacity, even
though it includes BESS costs (and ITC on BESS components but not on PV components).
brattle.com | 5
To explore uncertainty drivers
, we provide indicative
estimates under some alternative assumptions.
Choice of technology is the biggest uncertainty driver for
CONE, with some offsetting E&AS value differences.
–
Frame CT has much lower costs based on scaling to EIA, but with
more “shaft risk” and somewhat less flexibility. The indicative
Frame CONE starts with our current ERCOT aero CONE and
scales the capital and FOM components to that of a Frame vs.
aero within the EIA study.
–
New LM6000s may differ from the refurbished ones dominating
recent/planned ERCOT projects. We do not have visibility into
the cost discount on the refurbished turbines.
–
Choice of reference technology is the most controversial aspect
of CONE estimates in capacity markets, too (even though they
subtract net E&AS revenues).
ATWACC and levelization may be smaller drivers here.
Sensitivities to plant configuration & input costs not
explored here.
Uncertainty Drivers of CONE
Source:
EIA,
Capital Cost and Performance Characteristics for Utility-Scale Electric Power
Generating Technologies, prepared by Sargent & Lundy, January 2024
, Brattle analysis
Bottom-Up CONE for Reference and Alternative Tech
compared with indicative sensitivity analyses
1. EXECUTIVE SUMMARY
brattle.com | 6
Recognize that projecting CONE is not an exact science
The “revealed preference” approach reflects developer choices under
current market conditions; preferences could change
We analyze current bottom-up costs, but input costs can change
We estimate costs for a competitive developer, although costs vary
The ATWACC is grounded in empiricism but without plentiful data on the
full cost of capital for projects exactly like the ref tech
“Levelization” depends on developer views of revenue trajectory
With choice of reference tech being the biggest uncertainty
driver, is the aero the right technology with its high cost?
Multi LM6000PC is what developers are building and planning (in
addition to PV hybrids and standalone BESS). This must be for a reason.
–
Developers emphasize flexibility and low shaft risk in a market that sharply punishes
unavailability in shortages.
–
(And an unknown discount for refurbished turbines that may have limited availability).
Not for us to second-guess or speculate about other technologies they
should prefer under other conditions.
Hence we have no better recommendation than our LM6000 CONE
estimate, while recognizing the likelihood of some upward bias relative
to refurbished LM6000s, and that as conditions change, developer
preferences could change.
One can modify our assumptions to change CONE
Our CONE model will be posted, so one can change the key assumptions.
Or one can scale our results, e.g., our scaled indicated Frame estimate.
What are the implications of overstating or understating CONE?
For PNM purposes: higher CONE increases the “3xCONE” PNM threshold
where offer caps are lowered, which could increase costs for consumers.
For Reliability Standard cost impact estimation, higher CONE increases
system costs; for MERM estimation higher CONE decreases MERM.
For PCM purposes: a higher CONE could raise Net CONE, which could
increase the demand curve and boost reliability but increase costs.
(For all of these purposes, CONE accuracy matters, but so too does the
estimation of net E&AS revenues).
Other points on context
ERCOT could update CONE frequently in such a dynamic environment.
Texas Energy Fund (TEF) might subsidize certain new entrants, but to
support unsubsidized merchant entry, the market would need prices to
reach unsubsidized CONE.
Note that the PV+BESS benefits from incentives (ITC on BESS lowering
CONE, and PTC on PV increasing E&AS revenues), but those are widely
available for many years under the IRA, so we included them.
1. EXECUTIVE SUMMARY
What Can Policymakers Do with This Information
2. Reference and Alternative
Technology Characteristics
brattle.com | 8
Clarification
: CONE calculation is in terms of
seasonal net combustion turbine capacities, which
for LM6000PC turbines with SPRINT are
50.1 MW in winter (37°F),
48.5 MW at ISO conditions (59°F) and
40.7 MW in summer (94°F).
Update
: Changed reference technology to a “6 x 0”
plant configuration partially due to stakeholder
feedback and better alignment with median
number of units in dataset.
See additional responses in public document.
2. REFERENCE AND ALTERNATIVE TECHNOLOGY CHARACTERISTICS
Technical Assumptions: LM6000 Reference Technology
Technical Specs for LM6000 Plant
brattle.com | 9
No clarifications or updates to
Alternative Technology technical
characteristics presented at March
22
nd
SAWG meeting.
2. REFERENCE AND ALTERNATIVE TECHNOLOGY CHARACTERISTICS
Technical Assumptions: Hybrid Alternative Technology
Technical Specs for PV+BESS Hybrid
3. Bottom-up Cost Estimates
brattle.com | 11
Salient Observations
The CTGs are the biggest component, by far.
–
The choice of PC reflects “revealed preference” from actual projects
–
We assume new rather than refurbished and don’t know if
developers will still choose this technology if refurbished ones are
not available (e.g., new PF costs a little more than new PC but adds
about 13% more capacity; new frame is much cheaper per kW but
has very different operating characteristics)
Next biggest are other equipment, then labor
Then EPC fees & contingency, based on % of EPC costs
Key Assumptions
Sales tax is 7.5% of materials costs
EPC contractor fee
+
contingency are 19% of other EPC costs
Project development (5%), mobilization and start-
u
p (1%) and
non-fuel
i
nventories (1.5%) costs are based on total EPC costs
Electrical interconnection covered by Texas SB 1500 allowance
Gas interconnection assumes ½ mile lateral at $3.5m/mile
Owner’s contingency is 10% of other Owner’s costs
3. BOTTOM-UP COST ESTIMATES
LM6000 Plant: CAPEX
brattle.com | 12
Salient Observations
Insurance and firm gas contract are largest component
Next biggest are labor then property taxes
First-level nominal FOM costs are 18% higher than actual
first year FOM costs
Key Assumptions
Air emission standards are assumed to be met with the
inclusion of selective catalytic reduction systems
Maintenance and minor repairs are 10% of LTSA fixed costs
Firm gas costs are $3.1 million per year based on firm fuel
costs at existing/planned WattBridge facilities
Property taxes are 0.3% of overnight capital costs
Insurance is 0.6% of overnight capital costs
3. BOTTOM-UP COST ESTIMATES
LM6000 Plant: O&M
brattle.com | 13
3. BOTTOM-UP COST ESTIMATES
Comparison of LM6000 to 2024 EIA benchmark
Source:
EIA,
Capital Cost and Performance Characteristics for Utility-Scale Electric Power Generating Technologies, prepared by Sargent & Lundy, January 2024
.
Overnight costs for the LM6000 plant are
$82/kW higher in this study than in the 2024
EIA study
Our EPC costs are $161/kW higher because PFs
deliver 13% more power for a small additional
absolute cost compared to PCs
Our Non-EPC costs are $79/kW lower because
–
Our bigger 6x0 plant has better economies of
scale on non-EPC costs
–
Our electrical interconnection costs are covered
by the Texas Senate Bill 1500 allowance
–
Our gas interconnection excludes metering station
costs because of the high local availability of
natural gas transmission lines sufficient for CT
operation in Harris County
Comparison to EIA Benchmark
brattle.com | 14
Salient Observations
Nearly 70% of capital costs comes from PV and BESS
equipment supply costs, even with steep declines over
past several years
–
PV modules at only $355/kW
–
BESS at only $928/kW or $464/kWh for a 2-hour battery
Project development costs are responsible for 75% of
non-EPC costs
Key Assumptions
EPC contractor fee is 5% of other EPC costs
EPC contingency is 5% of other EPC costs + EPC
contractor fee
Project development (5%), mobilization and start-
u
p
(1%) are based on total EPC costs
Owner’s contingency is 10% of other Owner’s costs
3. BOTTOM-UP COST ESTIMATES
PV+BESS: CAPEX
brattle.com | 15
Salient Observations
Maintenance costs comprise over half of total
O&M costs
Key Assumptions
Land lease costs are based on a lease cost of $500
per acre and 1,400 acres needed
Property taxes (0.6%) and insurance (0.3%) are
based on overnight capital costs
Augmentation costs
–
28 MWh of augmentation are required in years 5, 10,
and 15 after COD to maintain capacity rating all 20
years
–
Starting augmentation costs are $313/kWh in 2024$
–
Augmentation costs are (de)escalated based on the
moderate case for the overnight capital cost trajectory
for 2-hour BESS from 2023 NREL ATB
3. BOTTOM-UP COST ESTIMATES
PV+BESS: O&M
Levelized Augmentation Costs (Nominal $/kW-yr)
Notes: Calculated present value of augmentation costs based on 10.35% ATWACC.
Applied capital charge to derive level-normalized first year revenue requirement
and divided figure by PV capacity.
4. Calculate CONE
brattle.com | 17
Objective: Escalate April 1st, 2024 cost estimates provided by Sargent & Lundy to the mid-point construction date
Cost Escalation During Construction
Estimate cost escalation rates
based on short-term inflation and real cost declines
–
Short-Term Inflation: Blended inflation rate from annual inflation forecasts (2024 = 3.0%, 2025 = 2.3%), based on Wolter
Kluwers’
Blue Chip Economic Indicators
–
LM6000 Real Cost Decline: 0.8% per year, based on
2023 NREL ATB
–
PV-BESS Real Cost Decline: 5.7% per year, based on
2023 NREL ATB
Establish mid-point construction date
based on June 1st, 2026 online date, months needed for construction, and
months needed for 50% of capital drawdown
–
LM6000: Construction Midpoint = T – 11 months, so July 1st,
2025
–
PV-BESS: Construction Midpoint = T – 8 months, so October 1st, 2025
Escalate costs to mid-point construction date
4. CALCULATE CONE
A. Escalate Bottom-up Costs to Construction Period
brattle.com | 18
CONE represents the first-year revenues a resource would need to enter, given its costs, its projected
future net revenue trajectory, and its cost of capital.
ERCOT agreed to assume the same 20-year level-nominal levelization we recommended in PJM
Level-nominal
: assumes that future revenues are constant in nominal terms.
–
This is appropriate where future entrants have increasingly competitive costs and performance, which will set market prices
lower and reduce the revenues of a plant built today, at approximately the rate of inflation in real terms.
–
LM6000 plant costs per kW are projected to decline at 0.8%/yr real, with bigger turbines with better economies of scale; plus
they would enjoy performance improvements.
Economic Lifetime
: We assume a 20-year economic lifetime
–
This does not mean the useful life is only 20-years
since new natural gas-fired plants can physically operate for 30 years or
longer, only that developers commonly expressed a preference to recover their capital in 20 years
Note that for the
PV+BESS alternative tech
technology progress is so rapid that a new entrant needs a
more front-loaded revenue recovery to compensate for future entrants sharply competing down prices
Based on NREL’s projected 3.0% real decline rate over the next 20 years, one could adopt a steeper levelization, but
we approximate with level-nominal, since that already assumes a 2.2% real decline
We still assume 20-year asset life
4. CALCULATE CONE
B. Design Levelization Approach
brattle.com | 19
C. Adjust Prior PJM ATWACC Estimate for ERCOT today
4. CALCULATE CONE
Sources: [1]
PJM CONE 2026/2027 Report
; [2]
Docket No. ER22-2984-000, PJM Interconnection LLC
; [3]
Gross Receipts, Tax Foundation
; [4]
20-year treasury bond yield, FRED
brattle.com | 20
A risk-appropriate discount rate
is needed for translating risky future cash flows into present values and deriving
the CONE value that makes the NPV equal to zero.
It is standard practice to
discount all-equity cash flows
(i.e., without deducted interest payments) using an after-tax
weighted-average cost of capital (ATWACC).
The ATWACC therefore
reflects the
systemic financial market risks
of the project’s future cash flows
and is used to
derive the first-year revenue requirement.
Only the ATWACC impacts the CONE calculation
, not the individual components of ATWACC, since
these are inter-
related and cannot be estimated in isolation; MM Theorem II, states that a company’s cost of debt and cost of
equity both increase with the amount of debt relative to the value of the project (“financial leverage”).
Some stakeholders mentioned that there could be higher, non-diversifiable risk in ERCOT vs PJM due to the market
regulatory environment which could warrant a 100 bps risk premium adder, this
would result in an ATWACC of
11.35%.
While we do not adopt this as our base case, we show the implications for CONE.
4. CALCULATE CONE
Application of ATWACC to CONE
brattle.com | 21
Salient Observations
Charge rate is fairly high because of 10.35% ATWACC,
combined with 20-yr level-nominal (charge rate =
first-year capital recovery, where CONE = Overnight
Cost × Charge Rate + FOM)
48% of CONE comes from turbine equipment costs
21% of CONE comes from labor costs
Key Assumptions
ATWACC = 10.35%
Overnight cost is the cost of all the inputs in April
2024, escalated to middle of the construction period
and expressed in nominal $
Installed cost includes overnight cost plus the cost of
capital between construction and the online date
CONE calculation is performed in a spreadsheet
model that accounts for taxes and depreciation
4. CALCULATE CONE
LM6000 Plant CONE
Note: CONE per 244 MW at Summer capacity would be $350/kW-year; and per 301 MW at Winter
capacity would be $284/kW-year in nominal $.
CONE Calculation for LM6000 Plant
brattle.com | 22
Salient Observations
Two-thirds of CONE comes from PV and BESS
equipment costs
Including PV and BESS cost declines from the 2023
NREL ATB reduces CONE by $17/kW-year
Including the impact of the ITC reduces CONE by
$18/kW-year
Augmentation costs contribute $3/kW-year to CONE
Key Assumptions
ATWACC = 10.35%
Storage enjoys 30% ITC; assume PV opts for PTC with
no effect on CONE
PV and BESS equipment costs are escalated at a
negative nominal rate because the magnitude of real
cost declines exceed general inflation
Other costs escalated at the rate of inflation
4. CALCULATE CONE
PV+BESS CONE
CONE Calculation for PV + BESS Plant
brattle.com | 23
To explore uncertainty drivers
, we provide indicative estimates
under some alternative assumptions, shown on the right
Choice of technology is the biggest uncertainty driver for CONE,
likely with some offsetting E&AS value differences
–
Frame has much lower costs based on scaling to EIA, albeit with more
“shaft risk” and somewhat less flexibility
–
New turbines may differ from the refurbished ones dominating
recent/planned ERCOT projects. We do not have visibility into the cost of
the limited refurbished turbine opportunities.
ATWACC and levelization may be smaller drivers in this context
Sensitivities to plant configuration & input costs not explored here
4. CALCULATE CONE
CONE Sensitivities
CONE estimates compared with indicative sensitivities
Timeline and Next Steps
brattle.com | 25
Project Timeline
brattle.com | 26
Listen to feedback today, and consider making changes accordingly
Finalize and publish CONE Model (an Excel workbook) and the CONE report
Next Steps
brattle.com | 27
Revisit Choice of Ref Tech
Consider resources further out in the queue
Interview developers on potential future technologies.
Refine Ref Tech E&AS analysis
CONE is useful in combination with other analyses of the net
E&AS revenues a plant can earn, whether that analysis is
conducted within “PNM” tracker, a MERM study, or a potential
PCM reference price setting exercise (based on Net CONE).
Ensure that those analyses adequately account for volatility
Refine ATWACC
: analyze empirical evidence on possible
ERCOT risk premium:
Although the cost of equity of a peaker plant in ERCOT is not
publicly traded and cannot be determined by market evidence,
we can
calculate gross margins
on a quarterly basis (electricity
revenues less fuel costs, divided by the electricity revenues).
One could use these gross margins to estimate the peaker’s
“
quasi-beta
,” i.e., the correlation with overall market returns
(while recognizing that gross margins are not the same as
returns on equity). Similarly, one could estimate the quasi-betas
of publicly-traded Gencos, since these Gencos’ quarterly gross
margins are reported in the SEC filings.
One could use the relative magnitudes of the quasi-betas to
determine if peaker units in ERCOT are exposed to more
systematic (non-diversifiable) risks than elsewhere. If yes, the
ratios of the quasi-betas can be used to determine the
additional risk premium for the COC of peaking plants.
4. CALCULATE CONE
Potential Future Study
The ERCOT Cone Study Draft, prepared by The Brattle Group for ERCOT, presents an in-depth analysis of the Cost of New Entry (CONE) for different energy technologies in the Texas market. The study includes detailed cost estimates, reference technology characteristics, and alternative technology analysis focusing on Aeroderivative LM6000 and Solar PV + BESS Hybrid systems. It outlines the methodology, calculations, and comparisons with benchmarks, offering insights into capital costs, overnight costs, and levelized costs. Overall, the study provides valuable information for decision-making in the energy sector.

Download Presentation

Please find below an Image/Link to download the presentation.
The content on the website is provided AS IS for your information and personal use only. It may not be sold, licensed, or shared on other websites without obtaining consent from the author. Download presentation by click this link. If you encounter any issues during the download, it is possible that the publisher has removed the file from their server.
E N D
Presentation Transcript
ERCOT CONE Study Draft PREPARED BY The Brattle Group Sam Newell Andrew W. Thompson Rohan Janakiraman PREPARED FOR ERCOT Sargent & Lundy Sang Gang Joshua Jung Hyojin Lee Preksha Nair MAY 24, 2024
Agenda Executive Summary Bottom-up Costs for Reference and Alternative Technology Draft CONE Results Project Timeline and Next Steps brattle.com | 1
Overview of CONE approach 1. Choose reference technology characteristics 2. Conduct bottom-up cost analysis 3. Calculate Cost of New Entry (CONE) Presented at March 22nd, 2024 SAWG meeting Will be presented in this meeting Will be presented in this meeting CONE represents the first-year revenues a resource would need to earn to enter, given its costs, its projected future net revenue trajectory, and its cost of capital Cost Estimates Bottom-up estimates of Capital and O&M costs as of April 2024 Longstanding Revealed Preference method led to: Reference Technology Aeroderivative LM6000 plant with 291 MW (at ISO conditions) in Harris County Then costs escalated to the mid- point construction period CONE Calculation Determine levelization shape (e.g., level-nominal) and lifetime Develop ATWACC Alternative Technology Solar PV + BESS Hybrid with 200 MW PV + 100 MW 2-hr BESS in Brazoria County Calculate first-year revenue requirement for NPV=0 in CONE spreadsheet model (accounts for taxes w/depreciation, etc.) brattle.com | 3
Summary of CONE Estimates for Reference Plants with COD June 2026 Definitions CONE Estimate for 291 MW (at ISO cond.) 6x0 LM6000 Overnight Cost Capital Charge Rate Levelized Capital Cost Nominal $/kW % Nominal $/kW-yr $1,764 14.0% $246 Overnight cost is the cost of all the inputs on a certain date (in our analysis, based on April 2024 cost rates and escalated to the middle of the construction period and expressed in nominal$. Levelized FOM Nominal $/kW-yr" $47 Capital charge rate is defined such that CONE = overnight cost capital charge rate + levelized FOM. Levelized CONE Nominal $/kW-yr $293 Comparisons to some benchmarks CONE Estimate for 200 MW PV w/100 MW 2-hr BESS Overnight Cost Nominal $/kW Capital Charge Rate % Levelized Capital Cost Nominal $/kW-yr $1,743 12.1% $210 Cost of LM6000 plant is comparable to EIA s latest. CONE of LM6000 is much higher than in PJM 2022 study ($190/kW-yr CC and $151/kW-yr Frame CT) because aeros cost more per kW and because ATWACC is 150 bp higher Levelized FOM Levelized Augmentation Nominal $/kW-yr Nominal $/kW-yr $49 $3 Alt tech has lower CONE and greater net E&AS revenues but serves a different purpose in the market. Levelized CONE Nominal $/kW-yr $263 The range reflects inherent differences and uncertainties. Notes: Both calculations use 10.35% ATWACC. The aero has a higher capital charge rate because of a longer construction period (incurring cost of capital) and longer depreciation. The CONE estimate for the hybrid is expressed as cost per kW of just the PV capacity, even though it includes BESS costs (and ITC on BESS components but not on PV components). brattle.com | 4
Uncertainty Drivers of CONE Bottom-Up CONE for Reference and Alternative Tech compared with indicative sensitivity analyses To explore uncertainty drivers, we provide indicative estimates under some alternative assumptions. Choice of technology is the biggest uncertainty driver for CONE, with some offsetting E&AS value differences. Frame CT has much lower costs based on scaling to EIA, but with more shaft risk and somewhat less flexibility. The indicative Frame CONE starts with our current ERCOT aero CONE and scales the capital and FOM components to that of a Frame vs. aero within the EIA study. New LM6000s may differ from the refurbished ones dominating recent/planned ERCOT projects. We do not have visibility into the cost discount on the refurbished turbines. Choice of reference technology is the most controversial aspect of CONE estimates in capacity markets, too (even though they subtract net E&AS revenues). ATWACC and levelization may be smaller drivers here. Sensitivities to plant configuration & input costs not explored here. Source: EIA, Capital Cost and Performance Characteristics for Utility-Scale Electric Power Generating Technologies, prepared by Sargent & Lundy, January 2024, Brattle analysis brattle.com | 5
What Can Policymakers Do with This Information Recognize that projecting CONE is not an exact science The revealed preference approach reflects developer choices under current market conditions; preferences could change We analyze current bottom-up costs, but input costs can change We estimate costs for a competitive developer, although costs vary The ATWACC is grounded in empiricism but without plentiful data on the full cost of capital for projects exactly like the ref tech Levelization depends on developer views of revenue trajectory One can modify our assumptions to change CONE Our CONE model will be posted, so one can change the key assumptions. Or one can scale our results, e.g., our scaled indicated Frame estimate. What are the implications of overstating or understating CONE? For PNM purposes: higher CONE increases the 3xCONE PNM threshold where offer caps are lowered, which could increase costs for consumers. For Reliability Standard cost impact estimation, higher CONE increases system costs; for MERM estimation higher CONE decreases MERM. With choice of reference tech being the biggest uncertainty driver, is the aero the right technology with its high cost? For PCM purposes: a higher CONE could raise Net CONE, which could increase the demand curve and boost reliability but increase costs. Multi LM6000PC is what developers are building and planning (in addition to PV hybrids and standalone BESS). This must be for a reason. Developers emphasize flexibility and low shaft risk in a market that sharply punishes unavailability in shortages. (And an unknown discount for refurbished turbines that may have limited availability). (For all of these purposes, CONE accuracy matters, but so too does the estimation of net E&AS revenues). Other points on context ERCOT could update CONE frequently in such a dynamic environment. Not for us to second-guess or speculate about other technologies they should prefer under other conditions. Texas Energy Fund (TEF) might subsidize certain new entrants, but to support unsubsidized merchant entry, the market would need prices to reach unsubsidized CONE. Hence we have no better recommendation than our LM6000 CONE estimate, while recognizing the likelihood of some upward bias relative to refurbished LM6000s, and that as conditions change, developer preferences could change. Note that the PV+BESS benefits from incentives (ITC on BESS lowering CONE, and PTC on PV increasing E&AS revenues), but those are widely available for many years under the IRA, so we included them. brattle.com | 6
2. Reference and Alternative Technology Characteristics
Technical Assumptions: LM6000 Reference Technology Technical Specs for LM6000 Plant Clarification: CONE calculation is in terms of seasonal net combustion turbine capacities, which for LM6000PC turbines with SPRINT are Technology and Size Generation Technology Aeroderivative Combustion Turbine 50.1 MW in winter (37 F), Turbine Model GE LM6000PC 48.5 MW at ISO conditions (59 F) and Configuration 6 x 0 40.7 MW in summer (94 F). Net Capacity (MW) Summer / ISO / Winter Update: Changed reference technology to a 6 x 0 plant configuration partially due to stakeholder feedback and better alignment with median number of units in dataset. 244.2 / 291.0 / 300.8 Detailed Design Fuel Type Natural gas, no secondary fuel Combustion Controls Selective Catalytic Reduction (SCR) See additional responses in public document. Power Augmentation Spray Intercooling (SPRINT) Other Project Details Location Harris County Firm Gas Contract Yes brattle.com | 8
Technical Assumptions: Hybrid Alternative Technology Technical Specs for PV+BESS Hybrid No clarifications or updates to Alternative Technology technical characteristics presented at March 22nd SAWG meeting. Technology and Size Configuration Solar PV + Battery Energy Storage System (BESS) Hybrid PV Capacity (MW) 200 BESS Storage Capacity (MW) 100 Storage Duration (Hours) 2 Detailed Design PV Module Technology Monocrystalline Bi-facial PERC PV Tracking System Single-axis tracker BESS Technology Lithium-ion AC or DC Coupled AC Coupled DC / AC Ratio 1.3 Other Project Details Location Brazoria County Design Life (years) 20 brattle.com | 9
Capital Cost Estimate (2024$ USD) EPC Cost LM6000 Plant: CAPEX Cost Component Owner Equipment - CTGs Owner Equipment - SCR & CEMS Other Equipment Construction Labor Other Labor Materials Sales Tax Costs w/o EPC Fee, Contingency EPC Contractor Fee EPC Contingency Total EPC Costs Unit $ $ $ $ $ $ $ $ $ $ $ 204,913,000 39,108,000 36,603,000 56,125,000 31,845,000 17,081,000 1,281,000 386,956,000 34,826,000 38,696,000 460,478,000 Salient Observations The CTGs are the biggest component, by far. The choice of PC reflects revealed preference from actual projects We assume new rather than refurbished and don t know if developers will still choose this technology if refurbished ones are not available (e.g., new PF costs a little more than new PC but adds about 13% more capacity; new frame is much cheaper per kW but has very different operating characteristics) Non-EPC Cost Cost Component Project Development Mobilization and Start-Up Net Start-up Fuel Costs Electrical Interconnection Gas Interconnection Land Fuel Inventories Non-Fuel Inventories Owner's Contingency Emission Reduction Credit Total Non-EPC Costs Unit Next biggest are other equipment, then labor $ $ $ $ $ $ $ $ $ $ $ 23,024,000 4,605,000 1,750,000 759,000 6,907,000 3,704,500 40,749,500 Then EPC fees & contingency, based on % of EPC costs - - Key Assumptions Sales tax is 7.5% of materials costs - EPC contractor fee + contingency are 19% of other EPC costs Project development (5%), mobilization and start-up (1%) and non-fuel inventories (1.5%) costs are based on total EPC costs - Total Overnight Capital Cost Electrical interconnection covered by Texas SB 1500 allowance Total Overnight Capital Cost Overnight Cost per 244 MW Summer Capacity Overnight Cost per 291 MW ISO Capacity Overnight Cost per 301 MW Winter Capacity $ 501,227,500 $/kW $/kW $/kW 2,053 1,722 1,666 Gas interconnection assumes mile lateral at $3.5m/mile Owner s contingency is 10% of other Owner s costs brattle.com | 11
O&M Cost Estimate (2024$ USD) Fixed O&M Cost LM6000 Plant: O&M Cost Component LTSA Fixed Payments Labor Maintenance and Minor Repairs Asset Management Administrative and General Property Taxes Insurance Firm Gas Contract FOM FOM per 244 MW Summer Cap FOM per 291 MW ISO Cap FOM per 301 MW Winter Cap Unit $ $ $ $ $ $ $ $ $ $/kW-yr $/kW-yr $/kW-yr 511,000 2,413,000 51,000 367,000 166,000 1,585,000 3,170,000 3,078,000 11,341,000 Salient Observations Insurance and firm gas contract are largest component Next biggest are labor then property taxes First-level nominal FOM costs are 18% higher than actual first year FOM costs 46.4 39.0 37.7 Key Assumptions Air emission standards are assumed to be met with the inclusion of selective catalytic reduction systems Variable O&M Cost Cost Component VOM in Summer Major Maintenance - Hours Based Consumables, Waste Disposal, and Other VOM VOM at ISO Conditions Major Maintenance - Hours Based Consumables, Waste Disposal, and Other VOM VOM in Winter Major Maintenance - Hours Based Consumables, Waste Disposal, and Other VOM Unit $/MWh $/MWh $/MWh $/MWh $/MWh $/MWh $/MWh $/MWh $/MWh Maintenance and minor repairs are 10% of LTSA fixed costs 9.00 8.26 0.74 7.66 6.93 0.73 7.44 6.71 0.73 Firm gas costs are $3.1 million per year based on firm fuel costs at existing/planned WattBridge facilities Property taxes are 0.3% of overnight capital costs Insurance is 0.6% of overnight capital costs brattle.com | 12
Comparison of LM6000 to 2024 EIA benchmark Overnight costs for the LM6000 plant are $82/kW higher in this study than in the 2024 EIA study Comparison to EIA Benchmark Units EIA This Study Difference Reference Plant Total EPC Costs Total Non-EPC Costs Overnight Capital Costs 2024$/kW 2024$/kW 2024$/kW 2024$/kW 4x0 LM6000PF 6x0 LM6000PC $1,435 $226 $1,661 Our EPC costs are $161/kW higher because PFs deliver 13% more power for a small additional absolute cost compared to PCs $1,596 $147 $1,743 $161 -$79 $82 Our Non-EPC costs are $79/kW lower because Our bigger 6x0 plant has better economies of scale on non-EPC costs Our electrical interconnection costs are covered by the Texas Senate Bill 1500 allowance Our gas interconnection excludes metering station costs because of the high local availability of natural gas transmission lines sufficient for CT operation in Harris County Source: EIA, Capital Cost and Performance Characteristics for Utility-Scale Electric Power Generating Technologies, prepared by Sargent & Lundy, January 2024. brattle.com | 13
Capital Cost Estimate (2024$ USD) EPC Cost PV+BESS: CAPEX Cost Component PV Module Supply PV Inverter Supply PV Racking, Tracker and BOP Equipment Supply Batteries and Enclosures BESS BOP Equipment Supply Main Power Transformer & Substation Construction and Installation SCADA Subcontract Civil/Structural/Architectural Subcontract Subtotal - EPC Costs w/o EPC Fee and Contingency EPC Contractor Fee EPC Contingency Total EPC Costs Unit $ $ $ $ $ $ $ $ $ $ $ $ $ Cost 70,963,000 14,735,000 63,741,000 82,125,000 10,686,000 8,610,000 35,095,000 1,220,000 18,353,000 305,528,000 15,276,400 16,040,000 336,844,400 Salient Observations Nearly 70% of capital costs comes from PV and BESS equipment supply costs, even with steep declines over past several years PV modules at only $355/kW BESS at only $928/kW or $464/kWh for a 2-hour battery Project development costs are responsible for 75% of non-EPC costs Key Assumptions Non-EPC Cost Cost Component Project Development Mobilization and Start-Up Electrical Interconnection Owner's Contingency Subtotal - Non-EPC Costs w/o Financing Fees Financing Fees Total Non-EPC Costs Unit $ $ $ $ $ $ $ Cost 16,842,220 3,368,444 EPC contractor fee is 5% of other EPC costs EPC contingency is 5% of other EPC costs + EPC contractor fee 0 2,021,000 22,231,664 Project development (5%), mobilization and start-up (1%) are based on total EPC costs 0 22,231,664 Owner s contingency is 10% of other Owner s costs Total Cost Total Overnight Capital Cost Total Overnight Capital Cost $ 359,076,064 $/kW 1,795 brattle.com | 14
O&M Cost Estimate (2024$ USD) Fixed O&M Cost PV+BESS: O&M Cost Component Maintenance (scheduled and unscheduled) Land Lease Property Taxes Insurance Total O&M Costs Total O&M Costs (without augmentation) Unit $/year $/year $/year $/year $/year $/kW-yr 4,370,000 700,000 2,154,000 1,077,000 8,301,000 41.51 Salient Observations Maintenance costs comprise over half of total O&M costs Key Assumptions Land lease costs are based on a lease cost of $500 per acre and 1,400 acres needed Levelized Augmentation Costs (Nominal $/kW-yr) Property taxes (0.6%) and insurance (0.3%) are based on overnight capital costs Variable Units Quantity Notes Augmentation costs 28 MWh of augmentation are required in years 5, 10, and 15 after COD to maintain capacity rating all 20 years Starting augmentation costs are $313/kWh in 2024$ Augmentation costs are (de)escalated based on the moderate case for the overnight capital cost trajectory for 2-hour BESS from 2023 NREL ATB Year 5 Costs Year 10 Costs Year 15 Costs Nominal $ Nominal $ Nominal $ $4,773,294 [1] $4,440,332 [2] $4,105,957 [3] Present Value of All Costs Capital Charge Rate Level-Nominal 1st-Year Revenue Requirement Nominal $/yr Nominal $ % $5,247,563 [4] 12.1% [5] 633,446 [6] Level-Nominal 1st-Year Revenue Requirement Nominal $/kW-yr 3.17 [7] Notes: Calculated present value of augmentation costs based on 10.35% ATWACC. Applied capital charge to derive level-normalized first year revenue requirement and divided figure by PV capacity. brattle.com | 15
A. Escalate Bottom-up Costs to Construction Period Objective: Escalate April 1st, 2024 cost estimates provided by Sargent & Lundy to the mid-point construction date Cost Escalation During Construction Estimate cost escalation rates based on short-term inflation and real cost declines Short-Term Inflation: Blended inflation rate from annual inflation forecasts (2024 = 3.0%, 2025 = 2.3%), based on Wolter Kluwers Blue Chip Economic Indicators LM6000 Real Cost Decline: 0.8% per year, based on 2023 NREL ATB PV-BESS Real Cost Decline: 5.7% per year, based on 2023 NREL ATB Establish mid-point construction date based on June 1st, 2026 online date, months needed for construction, and months needed for 50% of capital drawdown LM6000: Construction Midpoint = T 11 months, so July 1st,2025 PV-BESS: Construction Midpoint = T 8 months, so October 1st, 2025 Escalate costs to mid-point construction date brattle.com | 17
B. Design Levelization Approach CONE represents the first-year revenues a resource would need to enter, given its costs, its projected future net revenue trajectory, and its cost of capital. ERCOT agreed to assume the same 20-year level-nominal levelization we recommended in PJM Level-nominal: assumes that future revenues are constant in nominal terms. This is appropriate where future entrants have increasingly competitive costs and performance, which will set market prices lower and reduce the revenues of a plant built today, at approximately the rate of inflation in real terms. LM6000 plant costs per kW are projected to decline at 0.8%/yr real, with bigger turbines with better economies of scale; plus they would enjoy performance improvements. Economic Lifetime: We assume a 20-year economic lifetime This does not mean the useful life is only 20-years since new natural gas-fired plants can physically operate for 30 years or longer, only that developers commonly expressed a preference to recover their capital in 20 years Note that for the PV+BESS alternative tech technology progress is so rapid that a new entrant needs a more front-loaded revenue recovery to compensate for future entrants sharply competing down prices Based on NREL s projected 3.0% real decline rate over the next 20 years, one could adopt a steeper levelization, but we approximate with level-nominal, since that already assumes a 2.2% real decline We still assume 20-year asset life brattle.com | 18
C. Adjust Prior PJM ATWACC Estimate for ERCOT today We propose an ATWACCs of 10.35% reflecting the increase in the risk-free rate since August 31st, 2022 and lower state corporate income taxes in ERCOT Starting point (8.85% ATWACC) Brattle s 2022 estimate for merchant generation in PJM (see [1] and [2] below) ?????? = ???? ?? ?????? ?????? ????? + ???? ?? ???? ???? ????? (1 ??? ????) 1stAdjustment: State Corporate Income Tax ( 9.07% ATWACC) source In place of a corporate tax, Texas issues a gross receipts tax which can range from 0.331% to 0.75% (source) We used the approximate midpoint of the gross receipts tax (0.5%) as a proxy for corporate tax in ERCOT which is less than the average corporate tax rate in PJM (8.5%) Reducing the state tax rate to 0.5% leads to a 21.4% combined tax rate and increases the ATWACC by 22 bps, reflecting a less valuable debt-tax shield 2nd Adjustment: Risk Free Rate ( 10.35% ATWACC) source 20-year Treasury Bond yield increased by ~126 bps between August 2022 and April 2024 (source) This increases the ATWACC by 126 bps to result in 10.33%, which we round up to 10.35% Sources: [1] PJM CONE 2026/2027 Report; [2] Docket No. ER22-2984-000, PJM Interconnection LLC; [3] Gross Receipts, Tax Foundation; [4] 20-year treasury bond yield, FRED brattle.com | 19
Application of ATWACC to CONE A risk-appropriate discount rate is needed for translating risky future cash flows into present values and deriving the CONE value that makes the NPV equal to zero. It is standard practice to discount all-equity cash flows (i.e., without deducted interest payments) using an after-tax weighted-average cost of capital (ATWACC). The ATWACC therefore reflects the systemic financial market risks of the project s future cash flows and is used to derive the first-year revenue requirement. Only the ATWACC impacts the CONE calculation, not the individual components of ATWACC, since these are inter- related and cannot be estimated in isolation; MM Theorem II, states that a company s cost of debt and cost of equity both increase with the amount of debt relative to the value of the project ( financial leverage ). Some stakeholders mentioned that there could be higher, non-diversifiable risk in ERCOT vs PJM due to the market regulatory environment which could warrant a 100 bps risk premium adder, this would result in an ATWACC of 11.35%. While we do not adopt this as our base case, we show the implications for CONE. brattle.com | 20
LM6000 Plant CONE Salient Observations CONE Calculation for LM6000 Plant Charge rate is fairly high because of 10.35% ATWACC, combined with 20-yr level-nominal (charge rate = first-year capital recovery, where CONE = Overnight Cost Charge Rate + FOM) 6x0 LM6000 [1] Capacity at ISO conditions MW 291 Capital Costs [2] Overnight Cost [3] Overnight Cost [4] Capital Charge Rate [5] Levelized Capital Cost 48% of CONE comes from turbine equipment costs Nominal $ million Nominal $/kW % Nominal $/kW-yr $513 $1,764 14.0% $246 21% of CONE comes from labor costs = [2] x 1000 / [1] Key Assumptions = [3] x [4] ATWACC = 10.35% O&M Costs [6] First Year FOM [7] Levelized FOM Nominal $ million/yr Nominal $/kW-yr" $12 $47 Overnight cost is the cost of all the inputs in April 2024, escalated to middle of the construction period and expressed in nominal $ [8] Levelized CONE Nominal $/kW-yr $293 = [5] + [7] Installed cost includes overnight cost plus the cost of capital between construction and the online date Note: CONE per 244 MW at Summer capacity would be $350/kW-year; and per 301 MW at Winter capacity would be $284/kW-year in nominal $. CONE calculation is performed in a spreadsheet model that accounts for taxes and depreciation brattle.com | 21
PV+BESS CONE Salient Observations CONE Calculation for PV + BESS Plant Two-thirds of CONE comes from PV and BESS equipment costs PV + BESS Including PV and BESS cost declines from the 2023 NREL ATB reduces CONE by $17/kW-year [1] Plant Capacity MW 200 Capital Costs [2] Overnight Cost [3] Overnight Cost [4] Capital Charge Rate [5] Levelized Capital Cost Including the impact of the ITC reduces CONE by $18/kW-year Nominal $ million Nominal $/kW % Nominal $/kW-yr $349 $1,743 12.1% $210 = [2] x 1000 / [1] Augmentation costs contribute $3/kW-year to CONE = [3] x [4] Key Assumptions O&M Costs [6] First Year FOM [7] Levelized FOM [8] Levelized Augmentation Nominal $ million/yr Nominal $/kW-yr Nominal $/kW-yr $9 $49 $3 ATWACC = 10.35% Storage enjoys 30% ITC; assume PV opts for PTC with no effect on CONE [9] Levelized CONE Nominal $/kW-yr $263 PV and BESS equipment costs are escalated at a negative nominal rate because the magnitude of real cost declines exceed general inflation = [5] + [7] + [8] Other costs escalated at the rate of inflation brattle.com | 22
CONE Sensitivities CONE estimates compared with indicative sensitivities To explore uncertainty drivers, we provide indicative estimates under some alternative assumptions, shown on the right Choice of technology is the biggest uncertainty driver for CONE, likely with some offsetting E&AS value differences Frame has much lower costs based on scaling to EIA, albeit with more shaft risk and somewhat less flexibility New turbines may differ from the refurbished ones dominating recent/planned ERCOT projects. We do not have visibility into the cost of the limited refurbished turbine opportunities. ATWACC and levelization may be smaller drivers in this context Sensitivities to plant configuration & input costs not explored here CONE Sensitivity to Levelization Assumed Nominal Assumed Real Revenue Escalation Rate CONE CONE Levelization Method Revenue 6x0 LM6000 (2026 $/kW-yr) PV + BESS Escalation Rate (2026 $/kW-yr) Level-Real intermediate Level-Nominal more front-loaded 2.2% 1.4% 0.0% -0.8% 0.0% -0.8% -2.2% -3.0% $253 $268 $293 $263 $277 brattle.com | 23
Project Timeline Calendar Month Start of Week Jan Feb Mar Apr May Jun 1 8 15 22 29 5 12 19 26 4 11 18 25 1 8 15 22 29 6 13 20 27 3 10 17 24 CONE STUDY Task 1: Selection of Thermal Dispatchable Technology Task 2: Selection of Alternative Reference Technology Task 3: Develop Cost Estimates Task 4: Determine Financial & Cost Escalation Parameters Task 5: Briefing on Assumptions Task 6: Calculate CONEs Task 7: Draft CONE Study Report Task 8: Excel Workbook & Final CONE Study Report Task 9: CONE Study Presentations D F D F Draft Deliverable Final Deliverable Completed In progress Not started brattle.com | 25
Next Steps Listen to feedback today, and consider making changes accordingly Finalize and publish CONE Model (an Excel workbook) and the CONE report brattle.com | 26
Potential Future Study Revisit Choice of Ref Tech Refine ATWACC: analyze empirical evidence on possible ERCOT risk premium: Consider resources further out in the queue Although the cost of equity of a peaker plant in ERCOT is not publicly traded and cannot be determined by market evidence, we can calculate gross margins on a quarterly basis (electricity revenues less fuel costs, divided by the electricity revenues). Interview developers on potential future technologies. Refine Ref Tech E&AS analysis CONE is useful in combination with other analyses of the net E&AS revenues a plant can earn, whether that analysis is conducted within PNM tracker, a MERM study, or a potential PCM reference price setting exercise (based on Net CONE). One could use these gross margins to estimate the peaker s quasi-beta, i.e., the correlation with overall market returns (while recognizing that gross margins are not the same as returns on equity). Similarly, one could estimate the quasi-betas of publicly-traded Gencos, since these Gencos quarterly gross margins are reported in the SEC filings. Ensure that those analyses adequately account for volatility One could use the relative magnitudes of the quasi-betas to determine if peaker units in ERCOT are exposed to more systematic (non-diversifiable) risks than elsewhere. If yes, the ratios of the quasi-betas can be used to determine the additional risk premium for the COC of peaking plants. brattle.com | 27


")
")

")
")