Fourier Transform Infrared (FTIR) Spectroscopy Examples by Prof. Dr. Sulhattin YAŞAR

Fourier Transform Infrared (FTIR) spectroscopy is a technique used to obtain the absorption and emission spectra of solid, liquid, or gas substances. This content provides characteristic absorption peaks for various functional groups, such as alkane, alkyl, alkenyl, alkynyl, aromatic compounds, alcohols, phenols, carboxylic acids, amines, nitriles, aldehydes, ketones, esters, amides, and more. It also includes examples related to chemical bonds, food components analysis, and dry matter determination using PLSR models.

Download Presentation

Please find below an Image/Link to download the presentation.
The content on the website is provided AS IS for your information and personal use only. It may not be sold, licensed, or shared on other websites without obtaining consent from the author. Download presentation by click this link. If you encounter any issues during the download, it is possible that the publisher has removed the file from their server.
E N D
Presentation Transcript
FTIR spektroskopik rneklemeler Prof. Dr. Sulhattin YA AR (22/10/2019, I d r) Fourier d n ml k z l tesi spektroskopisi kat , s v veya gaz bir maddenin so urma ve emisyon k z l tesi spektrumunun elde edildi i bir spektroskopi tekni idir.
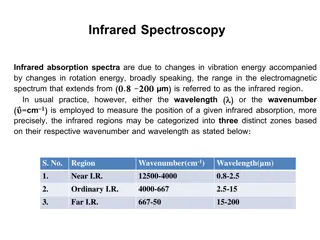
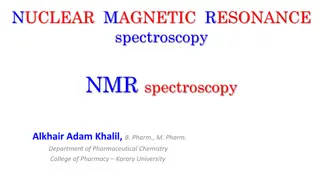
Characteristic Absorption(s) (cm-1) Functional Group Notes Alkane C-H bonds are fairly ubiquitous and therefore usually less useful in determining structure. Absorption peaks above 3000 cm-1are frequently diagnostic of unsaturation Alkyl C-H Stretch 2950 - 2850 (m or s) Alkenyl C-H Stretch Alkenyl C=C Stretch 3100 - 3010 (m) 1680 - 1620 (v) Alkynyl C-H Stretch Alkynyl C=C Stretch ~3300 (s) 2260 - 2100 (v) Aromatic C-H Stretch Aromatic C-H Bending Aromatic C=C Bending ~3030 (v) 860 - 680 (s) 1700 - 1500 (m,m) See "Free vs. Hyrdogen-Bonded Hydroxyl Groups" in the Introduction to IR Spectra for more information Alcohol/Phenol O-H Stretch 3550 - 3200 (broad, s) Carboxylic Acid O-H Stretch 3000 - 2500 (broad, v) Primary amines produce two N-H stretch absorptions, secondary amides only one, and tetriary none. Amine N-H Stretch 3500 - 3300 (m) Nitrile C=N Stretch 2260 - 2220 (m) Aldehyde C=O Stretch Ketone C=O Stretch Ester C=O Stretch Carboxylic Acid C=O Stretch Amide C=O Stretch The carbonyl stretching absorption is one of the strongest IR absorptions, and is very useful in structure determination as one can determine both the number of carbonyl groups (assuming peaks do not overlap) but also an estimation of which types. 1740 - 1690 (s) 1750 - 1680 (s) 1750 - 1735 (s) 1780 - 1710 (s) 1690 - 1630 (s) As with amines, an amide produces zero to two N-H absorptions depending on its type. Amide N-H Stretch 3700 - 3500 (m)
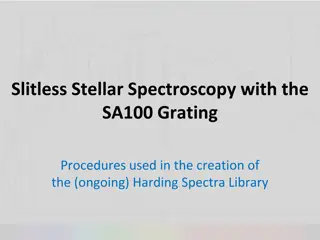
Kuru Madde Tayini TABLE 2. Predictive abilities of PLSR models for dry matter (DM) and crude ash (CA)from the absorbance peaks over a IR spectra ranging from 3500 to 800 cm-1 Non-spiked SFM C sample spiked with KCl Samples A B C C1 C2 C3 C4 DM analysed values Mean (%) Sdev (%) 88.84 0.49 91.37 0.55 90.61 0.45 92.94 0.89 96.13 0.18 99.00 0.36 99.23 0.07 Predicted values by the model 1 using original spectra data Mean (%) Sdev (%) 90.69 0.332 89.57 0.299 90.87 0.302 92.40 0.355 96.40 0.66 95.19 0.87 100.17 0.21 SECV 0.292 0.358 0.287 0.392 0.618 1.160 0.521 RPD Predicted values by the model 2 using D' spectra data Mean (%) Sdev (%) 1.67 1.53 1.56 2.27 0.29 0.310 0.00 90.01 0.86 89.36 0.53 92.1 0.51 92.53 0.40 96.12 0.22 96.44 1.52 99.30 0.27 SECV 0.28 0.39 0.26 0.33 0.33 0.53 0.40 RPD Predicted values by the model 3 using D'' spectra data Mean (%) Sdev (%) 1.75 1.41 1.73 2.69 0.54 0.68 0.17 89.10 0.84 90.70 0.45 90.96 0.33 92.80 0.20 95.84 0.14 100.76 1.50 99.00 0.21 SECV 0.15 0.17 0.14 0.14 0.14 0.49 0.16 RPD 3.26 3.23 3.21 6.35 1.00 0.73 0.00
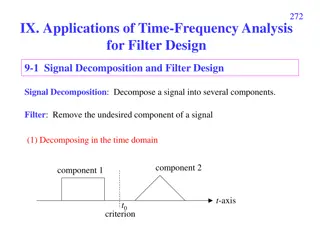
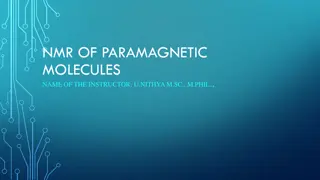
SFK _sekonder protein bileen tayini Fig. S1. Cumulative Gaussian curve fitting (black line) of FSD data (dotted line) to quantify individual secondary protein components (blue lines) of Amide I protein band (grey line) of unfermented SBM sample. The FSD data was normalised and rescaled by asymmetric base line correction and subtraction. The calculated area of absorption of each component was expressed as percentage of total fitted curve area. Note that the unfermented SBM has no random coil component.
SONU FTIR spekra l mleri ile rnekler aras nda farkl l klar g rsel olarak tespit edilebilir. rnekler zerine uygulamalar n etkileri peak absorbans ve y kseklik de erleri l m yolu rahat bir ekilde rakamsal olarak belirlenip istatistik analizleri yap labilir. FTIR spektroskopisi, t r, e it, su , tip vb belirlemede rahatl kla kullan labilecek ucuz ve h zl bir metotdur. Metot, ayet ileri istatistik y ntemler ile birlikte kullan l r ise ya yakma (kimyasal analiz) metotlar na g re daha hassas sonu lar vermektedir.