Exploring Brain Waves Through EEG Analysis

Analyze Brain Waves
Brain Wave Review
EEG, EKG, and EMG
●
We can measure the electrical activity of our nervous system, heart, and
muscles using EEG, EKG, and EMG, respectively
○
EEG stands for
electroencephalogram
, and it is used to measure brain waves
○
EKG (or ECG) stands for
electrocardiogram
, and it is used to measure electrical signals in
the heart muscle
○
EMG stands for
electromyogram
, and it is used to measure electrical signals in the
muscles
●
In this lecture, we will focus on
EEG
, and how we can analyze the
measured waves
Our Toolbox
●
Now that we know about the different types of brain waves, how do we
take a brain wave dataset and determine which waves are present?
○
We can use the following mathematical processes to “break down” a raw EEG signal and
analyze it:
■
Fast Fourier Transform (FFT)
■
Power Spectral Density (PSD)
■
Bandpass Filter
Fast Fourier Transform (FFT)
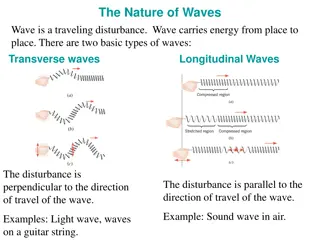
●
Sinusoids observed in the real world are not “perfect,” but they can be
modeled using combinations of sinusoids
○
Example: The
black
signal below is modeled using a combination of the
pink
signals
below it
Fast Fourier Transform (FFT)
●
A
Fast Fourier Transform (FFT)
may be used to visualize the different
frequencies of a signal’s component sinusoids
●
When we measure the raw EEG of a brain wave, we use the FFT to plot all the
component frequencies observed in the wave
○
Using the FFT output, we can see which frequencies are “dominant” (appear the most) in the raw
signal
○
If we notice that a frequency of ~ 1 Hz is dominant, we can conclude that the person is likely in a
deep sleep since this frequency is representative of the
delta wave
●
We won’t worry about the details of the FFT—just know what it’s used for!
Fast Fourier Transform (FFT) Example
Example of a Real-Time EEG with FFT
Power Spectral Density (PSD)
●
T
h
e
p
o
w
e
r
s
p
e
c
t
r
a
l
d
e
n
s
i
t
y
(
P
S
D
)
i
s
t
h
e
d
i
s
t
r
i
b
u
t
i
o
n
o
f
t
h
e
s
i
g
n
a
l
’
s
p
o
w
e
r
o
v
e
r
t
h
e
f
r
e
q
u
e
n
c
y
●
When we want to analyze which types of brain waves are dominant in a raw
EEG signal, we can calculate and plot the PSD of the signal to visualize
which waves “occur” most often in the signal
Power Spectral Density (PSD) Example
●
In the example below, there are two peaks at
f = 40 Hz
and
f = 75 Hz
○
These peaks show us that most of the original signal’s power comes from waveforms with
frequency 40 Hz and 75 Hz
Bandpass Filter
●
A
bandpass filter
may be used to “filter out” parts of the original signal
that are not within a range (or band) of specified frequencies
●
When we are analyzing an EEG signal, we can choose to only view wave
components that are within the frequency range of a specific type of brain
wave
○
Example: We can choose the band 9 Hz – 13 Hz if we wish to view the
alpha wave
components
Bandpass Filter
Compare
EEG
Results
Delve into the world of brain waves with EEG, EKG, and EMG measurements. Learn how to analyze brain wave data using mathematical processes like Fast Fourier Transform (FFT) and Power Spectral Density (PSD). Discover the significance of different frequencies in brain wave signals and how they reflect mental states such as deep sleep. Uncover the tools and techniques used to study and interpret electrical activity in the brain, heart, and muscles.

Download Presentation

Please find below an Image/Link to download the presentation.
The content on the website is provided AS IS for your information and personal use only. It may not be sold, licensed, or shared on other websites without obtaining consent from the author. Download presentation by click this link. If you encounter any issues during the download, it is possible that the publisher has removed the file from their server.
E N D
Presentation Transcript
EEG, EKG, and EMG We can measure the electrical activity of our nervous system, heart, and muscles using EEG, EKG, and EMG, respectively EEG stands for electroencephalogram, and it is used to measure brain waves EKG (or ECG) stands for electrocardiogram, and it is used to measure electrical signals in the heart muscle EMG stands for electromyogram, and it is used to measure electrical signals in the muscles In this lecture, we will focus on EEG, and how we can analyze the measured waves
Our Toolbox Now that we know about the different types of brain waves, how do we take a brain wave dataset and determine which waves are present? We can use the following mathematical processes to break down a raw EEG signal and analyze it: Fast Fourier Transform (FFT) Power Spectral Density (PSD) Bandpass Filter
Fast Fourier Transform (FFT) Sinusoids observed in the real world are not perfect, but they can be modeled using combinations of sinusoids Example: The black signal below is modeled using a combination of the pink signals below it
Fast Fourier Transform (FFT) A Fast Fourier Transform (FFT) may be used to visualize the different frequencies of a signal s component sinusoids When we measure the raw EEG of a brain wave, we use the FFT to plot all the component frequencies observed in the wave Using the FFT output, we can see which frequencies are dominant (appear the most) in the raw signal If we notice that a frequency of ~ 1 Hz is dominant, we can conclude that the person is likely in a deep sleep since this frequency is representative of the delta wave We won t worry about the details of the FFT just know what it s used for!
Power Spectral Density (PSD) The power spectral density (PSD) is the distribution of the signal s power over the frequency When we want to analyze which types of brain waves are dominant in a raw EEG signal, we can calculate and plot the PSD of the signal to visualize which waves occur most often in the signal
Power Spectral Density (PSD) Example In the example below, there are two peaks at f = 40 Hz and f = 75 Hz These peaks show us that most of the original signal s power comes from waveforms with frequency 40 Hz and 75 Hz
Bandpass Filter A bandpass filter may be used to filter out parts of the original signal that are not within a range (or band) of specified frequencies When we are analyzing an EEG signal, we can choose to only view wave components that are within the frequency range of a specific type of brain wave Example: We can choose the band 9 Hz 13 Hz if we wish to view the alpha wave components
Compare EEG Results


")
")
 Example")

")
 Example")