Fundamentals of Probability and Statistics in Computational Network Biology
Explore the fundamental concepts of probability and statistics in computational network biology with a focus on sample spaces, random variables, probability distributions, and notation. Gain insights into the intuitive definition of probability, sample spaces for various experiments, different types of random variables, and discrete probability distributions.

Download Presentation

Please find below an Image/Link to download the presentation.
The content on the website is provided AS IS for your information and personal use only. It may not be sold, licensed, or shared on other websites without obtaining consent from the author. Download presentation by click this link. If you encounter any issues during the download, it is possible that the publisher has removed the file from their server.
E N D
Presentation Transcript
Introduction to probability and statistics Alireza Fotuhi Siahpirani & Brittany Baur sroy@biostat.wisc.edu Computational Network Biology Biostatistics & Medical Informatics 826 https://compnetbiocourse.discovery.wisc.edu Sep 13th 2016 Some of the material covered in this lecture is adapted from BMI 576
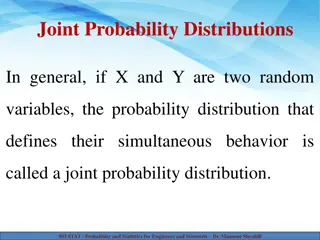
Goals for today Probability primer Introduction to linear regression
A few key concepts Sample spaces Random variables Discrete and continuous continuous distributions Joint, conditional and marginal distributions Statistical independence
Definition of probability Intuitively, we use probability to refer to our degree of confidence in an event of an uncertain nature. Always a number in the interval [0,1] 0 means never occurs 1 means always occurs
Sample space Sample space: a set of possible outcomes for some experiment Examples Flight to Chicago: {on time, late} Lottery: {ticket 1 wins, ticket 2 wins, ,ticket n wins} Weather tomorrow: {rain, not rain} or {sun, rain, snow} or {sun, clouds, rain, snow, sleet} Roll of a die: {1,2,3,4,5,6} Coin toss: {Heads, Tail}
Random variables Random variable: A variable that represents the outcome of a uncertain experiment A random variable can be Discrete/Categorical: Outcomes take a fixed set of values Roll of die, flight to Chicago, weather tomorrow Continuous: Outcomes take continuous values Height, weight
Notation Uppercase letters and words denote random variables X, Y Lowercase letters and words denote values x, y Probability that X takes value x P(X = x) We will also use the shorthand form P(x) for P(X=x) For Boolean random variables, we will use the shorthand P(fever) forP(Fever = true) P( fever) forP(Fever = false)
Discrete probability distributions A probability distribution is a mathematical function that specifies the probability of each possible outcome of a random variable We denote this as P(X) for random variable X It specifies the probability of each possible value of X, x Requirements: 0.3 P(x) 0 for every x 0.2 0.1 x P(x)=1
Joint probability distributions Joint probability distribution: the function given by P(X = x, Y = y) Read as X equals x and Y equals y Example x, y P(X = x, Y = y) probability that it s sunny and my flight is on time sun, on-time 0.20 rain, on-time 0.20 snow, on-time 0.05 sun, late 0.10 rain, late 0.30 snow, late 0.15
Marginal probability distributions The marginal distribution of X is defined by P(x)= P(x,y) y the distribution of Xignoring other variables This definition generalizes to more than two variables, e.g. P(x)= P(x,y,z) y z
Marginal distribution example marginal distribution for X joint distribution x, y P(X = x, Y = y) P(X = x) x sun, on-time sun 0.20 0.3 rain, on-time rain 0.20 0.5 snow, on-time snow 0.05 0.2 sun, late 0.10 rain, late 0.30 snow, late 0.15
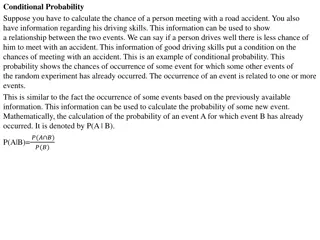
Conditional distributions The conditional distribution of Xgiven Y is defined as: P(X = x |Y = y) =P(X = x,Y = y) P(Y = y) Or in short P(X |Y)=P(X,Y) P(Y) The distribution of X given that we know the value of Y Intuitively, how much does knowing Y tell us about X?
Conditional distribution example conditional distribution for X givenY=on-time joint distribution x, y P(X = x, Y = y) P(X = x|Y=on-time) x sun, on-time sun 0.20 0.20/0.45 = 0.444 rain, on-time rain 0.20 0.20/0.45 = 0.444 snow, on-time snow 0.05 0.05/0.45 = 0.111 sun, late 0.10 rain, late 0.30 snow, late 0.15
Independence Two random variables, X and Y, are independent if P(x,y)=P(x) P(y) for all x and y Another way to think about this is knowing X does not tell us anything about Y
Independence example #1 joint distribution marginal distributions P(X = x, Y = y) x, y P(X = x) x sun, on-time sun 0.20 0.3 rain, on-time rain 0.20 0.5 snow, on-time snow 0.05 0.2 sun, late 0.10 P(Y = y) y rain, late 0.30 on-time 0.45 snow, late 0.15 late 0.55 Are X and Y independent here? NO.
Independence example #2 joint distribution marginal distributions P(X = x, Y = y) x, y P(X = x) x sun, fly-United sun 0.27 0.3 rain, fly-United rain 0.45 0.5 snow, fly-United snow 0.18 0.2 sun, fly-Northwest 0.03 P(Y = y) y rain, fly-Northwest 0.05 fly-United 0.9 snow, fly-Northwest 0.02 fly-Northwest 0.1 Are X and Y independent here? YES.
Conditional independence Two random variables X and Y are conditionally independent given Z if P(X |Y,Z)= P(X |Z) once you know the value of Z, knowing Ydoesn t tell you anything about X Alternatively P(x,y |z)=P(x |z) P(y |z) for all x,y,z
Conditional independence example Flu true true true true false false false false Fever true true false false true true false false Headache true false true false true false true false P 0.04 0.04 0.01 0.01 0.009 0.081 0.081 0.729 Are Fever and Headache independent? NO. e.g. P(fever,headache) P(fever) P(headache)
Conditional independence example Flu true true true true false false false false Fever true true false false true true false false Headache true false true false true false true false P 0.04 0.04 0.01 0.01 0.009 0.081 0.081 0.729 Are Fever and Headache conditionally independent given Flu: YES. P(fever,headache | flu) = P( fever | flu) P(headache | flu) P(fever,headache | flu) = P( fever | flu) P(headache | flu) etc.
Chain rule of probability For two variables P(X,Y)=P(X |Y) P(Y) For three variables P(X,Y,Z)=P(X |Y,Z) P(Y |Z) P(Z) To see that this is true, note that P(X,Y,Z)=P(X,Y,Z) P(Y,Z) etc. P(Y,Z) P(Z) P(Z)
Example discrete distributions Binomial distribution Multinomial distribution
The binomial distribution Two outcomes per trial of an experiment Distribution over the number of successes in a fixed number n of independent trials (with same probability of success p in each) n x px(1- p)n-x P(x)= e.g. the probability of x heads in ncoin flips p=0.5 p=0.1 P(X=x) P(X=x) x x
The multinomial distribution A generalization of the binomial distribution to more than two outcomes Provides a distribution of the number of times any of the outcomes happen. For example consider rolling of a die n= 100 times. Each time we can have one of k = 6 outcomes, 1,..,6 ??is the variable representing the number of times the die landed on the ith face, ? {1,..,6} ??is the probability of the die landing on the ith face
Continuous random variables When our outcome is a continuous number we need a continuous random variable Examples: Weight, Height We specify a density function for random variable X as Probabilities are specified over an interval Probability of taking on a single value is 0.
Continuous random variables contd To define a probability distribution for a continuous variable, we need to integrate f(x)
Example continuous distributions Uniform distribution Gaussian distribution Exponential distribution
Uniform distribution A variable X is said to have a uniform distribution, between [?,?], where, ? < ?, if ?(?) 1 ? ? a b x Adapted from Wikipedia
Gaussian Distribution The univariate Gaussian distribution is defined by two parameters, Mean: ? and Standard deviation: ? From Wikipedia: Normal distribution, https://en.wikipedia.org/wiki/Normal_distribution
Exponential Distribution Exponential distribution for a random variable X is defined as From Wikipedia: Exponential distribution, https://en.wikipedia.org/wiki/Exponential_distribution
Goals for today Probability primer Introduction to linear regression
Linear regression y x Slope Intercept Linear regression assumes that output (y) is a linear function of the input (x) Given: Data= Estimate:
Residual Sum of Squares (RSS) y Residual x To find the ?, we need to minimize the Residual Sum of Squares
Minimizing RSS y Residual x
Linear regression with p inputs Y: output Inputs: intercept Parameters/coefficients Given: Data= Estimate:
Ordinary least squares for estimating ? Pick the ? that minimizes the residual sum of squares RSS
How to minimize RSS? Easier to think in matrix form This is the square of y-Xb in matrix world
Simple matrix calculus 1. 2. 3. The Matrix Cookbook https://www.math.uwaterloo.ca/~hwolkowi/matrixcookbook.pdf
Estimating ? by minimizing RSS Works well when (XTX)-1 is invertible. But often this is not true. Need to regularize or add a prior
References Chapter 2, Probabilistic Graphical Models. Principles and Techniques. Friedman & Koller. Slides adapted from Prof. Mark Craven s Introduction to Bioinformatics lectures. All of Statistics, Larry Wasserman. Chapter 3, The Elements of Statistical Learning, Hastie, Tibshirani, Friedman.


")