Understanding Probability in Year 8 Mathematics
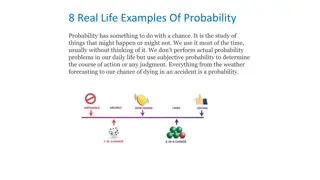
Dive into the world of probability with Year 8 students as they explore concepts like coin flips, card draws, and meal choices. Through engaging activities and examples, students learn how to calculate probabilities, write them in different forms, and determine outcomes. Discover the fun and challenges of probability through real-life scenarios and hypothetical events.

Download Presentation

Please find below an Image/Link to download the presentation.
The content on the website is provided AS IS for your information and personal use only. It may not be sold, licensed, or shared on other websites without obtaining consent from the author. Download presentation by click this link. If you encounter any issues during the download, it is possible that the publisher has removed the file from their server.
E N D
Presentation Transcript
Year 8: Probability Dr J Frost (jfrost@tiffin.kingston.sch.uk) Last modified: 29th August 2015
Recap: Probability Scale 0 0.5 1 Getting a Heads on the flip of a coin Going to sleep tonight Scoring 101% on a test Winning the UK Lottery A Tiffin student travelling to school by bus Being left- handed
How to write probabilities Probability of winning the UK lottery: 1 in 14,000,000 ___1___ 14000000 ? ? Odds Form Fractional Form 0.000000714 0.0000714% ? ? Decimal Form Percentage Form Which is best in this case?
Calculating a probability outcomes matching event total outcomes P(event) = Probability of picking a Jack from a pack of cards? P(Jack) = _4_ ? ? 52
Activity 1 (fill in on your exercise pack) List out all the possible outcomes given each description, underline or circle the outcomes that match, and hence work out the probability. The set of all possible outcomes is known as the sample space. Event Outcomes Probability 1 Getting one heads and one tails on the throw of two coins. HH, HT, TH, TT 1/2 ? ? 2 Getting two tails after two throws. HH, HT, TH, TT 1/4 3 Getting at least 2 heads after 3 throws. HHH, HHT, HTH, HTT, THH, THT, TTH, TTT 1/2 ? ? ? ? ? ? ? ? 4 Getting exactly 2 heads after 3 throws. HHH, HHT, HTH, HTT, THH, THT, TTH, TTT 3/8 5 Rolling a prime number and throwing a head. 1H, 2H, 3H, 4H, 5H, 6H, 1T, 2T, 3T, 4T, 5T, 6T 1/4 6 In three throws of a coin, a heads never follows a tails. HHH, HHT, HTH, HTT, THH, THT, TTH, TTT 1/2 7 For a randomly chosen meal with possible starters Avacado, Beans and Cauliflower, and possible main courses Dog, Escalopes or Fish, ending up with neither Avacado nor Dog. AD, AE, AF, BD, BE, BF, CD, CE, CF 4/9 ? ?
Activity 2 Sometimes we can reason how many outcomes there will be without the need to list them. Event Num matching outcomes Num total outcomes Probability 1 Drawing a Jack from a pack of cards. 4 52 P(J) = 4/52 = 1/13 ? ? ? ? ? ? ? ? ? ? ? ? ? ? ? ? ? ? ? ? ? ? ? ? ? ? 2 Drawing a club from a pack of cards. 13 52 P(Club) = 13/52 = 1/4 3 Drawing a card which is either a club or is an even number. Throwing two sixes on a die in a row. 28 52 P(even or club) = 7/13 4 1 36 P(66) = 1/36 5 Throwing an even number on a die followed by an odd number. 9 36 P(even-odd) = 1/4 6 Throwing three square numbers on a die in a row. Seeing exactly two heads in four throws of a coin. Seeing the word BOB when arranging two plastic Bs and an O on a sign. 8 216 P(three square) = 1/27 7 6 16 P(two Heads) = 3/8 8 2 6 P(BOB) = 1/3 Seeing the word LOLLY when arranging a letter O, Y and three letter Ls on a sign. 6 120 P(LOLLY) = 1/20 4! x (13!)4 After shuffling a pack of cards, the cards in each suit are all together. 52! Roughly 1 in 2 billion billion billion. ?
Recap: Combinatorics Combinatorics is the number of ways of arranging something . We could consider how many things could do in each slot , then multiply these numbers together. 1 How many 5 letter English words could there theoretically be? B I L B O ? 26 x 26 x 26 x 26 x 26 = 265 2 How many 5 letter English words with distinct letters could there be? S M A U G ? 26 x 25 x 24 x 23 x 22 = 7893600 3 How many ways of arranging the letters in SHELF? E L F H S 5 x 4 x 3 x 2 x 1 = 5! ( 5 factorial ) ?
Activity 3 For this activity, it may be helpful to have four cards, numbered 1 to 4. Event Num matching outcomes Num total outcomes Probability 1 One number randomly picked being even. The four numbers, when randomly placed in a line, reads 1-2-3-4 Two numbers, when placed in a line, contain a two and a three. Three numbers, when placed in a line, form a descending sequence. Two numbers, when placed in a line, give a sum of 5. When you pick a number out a bag, look at the value then put it back, then pick a number again, both numbers are 1. When you pick a number from a bag, put the number back, and do this 4 times in total, the values of your numbers form a run of 1 to 4 in any order (e.g. 1234, 4231, ...). P(Even) = 2/4 2 ? ? ? ? ? 4 ? ? ? ? ? ? ? ? ? ? 2 1 4! = 24 P(1, 2, 3, 4) = 1/24 3 2 12 P(2 with 3) = 1/6 4 3 24 P(Descending) = 1/8 5 4 12 P(Sum of 5) = 1/3 6 1 ? 16 ? P(1, 1) = 1/16 ? 44 = 256 4! = 24 P(run) = 3/32 ? ? ?
2D Sample Spaces We previously saw that a sample space was the set of all possible outcomes. Sometimes it s more convenient to present the outcomes in a table. Q: If I throw a fair coin and fair die, what is the probability I see a prime number or a tails? 1D Sample Space 2D Sample Space Ensure you label your axis . { H1, H2, H3, H4, H5, H6, T1, T2, T3, T4, T5, T6 } Die 1 2 3 4 5 6 Coin H H1 H2 H3 H4 H5 H6 T T1 T2 T3 T4 T5 T6 ? P(prime or T) = 9/12 P(prime or T) = 9/12
2D Sample Spaces Suppose we roll two fair dice, and add up the scores from the two dice. What s the probability that: a) My total is 10? 3/36 = 1/12 b) My total is at least 10? 6/36 = 1/6 c) My total is at most 9? 5/6 ? ? ? Second Dice Three of the outcomes match the event total is 10 . And there s 36 outcomes in total. + 1 2 3 4 5 6 ? ? ? ? ? ? 1 2 3 4 5 6 7 2 3 4 5 6 7 8 First Dice 3 4 5 6 7 8 9 ? 4 5 6 7 8 9 10 At most 9 is like saying NOT at least 10 . So we can subtract the probability from 1. 5 6 7 8 9 10 11 6 7 8 9 10 11 12
Exercise 4 1 3 After throwing 2 fair coins. After throwing 2 fair die and multiplying. 2nd Coin 2nd Coin 3 x 1 2 4 5 6 H ? T 1st Coin 1 1 2 3 4 5 6 1st Coin 4 6 ??? P(product 6) = 1/9 P(product <= 6) = 7/18 P(product >= 7) = 11/18 P(product odd) = 1/4 H HH HT 2 2 6 ? 8 10 12 1st Die T TH TT 3 3 9 12 15 18 ? 4 4 8 12 16 20 24 ? P(HH) = 1/4 P(H and T) = 1/2 5 5 10 15 20 25 30 ? 6 6 12 18 24 30 36 2 After throwing 2 fair die and adding. 2nd Die After spinning two spinners, one A, B, C and one A, B, C, D. 4 2nd Coin 3 4 + 1 2 5 6 2nd Spinner 1st Coin 1 2 3 4 5 6 7 A B C D ? P(total prime) = 15/36 P(total < 4) = 1/12 P( total odd) = 1/2 1st Spinner ?? 2 3 4 5 ? 6 7 8 A AA AB ? AC AD 1st Die 3 4 5 6 7 8 9 B BA BB BC BD 4 5 6 7 8 9 10 C CA CB CC CD ? 5 6 7 8 9 10 11 P(both vowels) = 1/12 P( vowel) = 1/2 P(B and C) = 1/6 ? ? 6 7 8 9 10 11 12
Events and Mutually Exclusive Events Examples of events: Throwing a 6, throwing an odd number, tossing a heads, a randomly chosen person having a height above 1.5m. ? An event in probability is a description of one or more outcomes. (More formally, it is any subset of the sample space) We often represent an event using a single capital letter, e.g. P(A) = 2/3. ? If two events A and B are mutually exclusive, then they can t happen at the same time, and: P(A or B) = P(A) + P(B) ? You may recall from the end of Year 7, when we covered Set Theory, that A B meant you are in set A, orin set B . Since events are just sets of outcomes, we can formally write P(A or B) as P(A B).
Events not happening A means that A does not happen. P(A ) = 1 P(A) ? Quick practice: A and B are mutually exclusive events and P(A) = 0.3, P(B) = 0.2 P(A or B) = 0.5, P(A ) = 0.7, P(B ) = 0.8 ? 1 ? ? C and D are mutually exclusive events and P(C ) = 0.6, P(D) = 0.1 P(C or D) = 0.5 ? 2 E, F and G are mutually exclusive events and P(E or F) = 0.6 and P(F or G) = 0.7 and P(E or F or G) = 1 P(F) = 0.3 P(E) = 0.3 P(G) = 0.4 3 ? ??
Test your understanding A bag consists of red, blue and green balls. The probability of picking a red ball is 1/3 and a blue ball 1/4. What is the probability of picking a green ball? An unfair spinner is spun. The probability of getting A, B, C and D is indicated in the table below. Determine x. A B C D 0.1 x 0.4 x ? P(R) = 5/12 x = 0.25 ?
Exercise 5 (on your sheet) In the following questions, all events are mutually exclusive. P(A) = 0.6, P(C) = 0.2 P(A ) = 0.4, P(C ) = 0.8 P(A or C) = 0.8 ? ? All Tiffin students are either good at maths, English or music, but not at more than one subject. The probability that a student is good at maths is 1/5. The probability they are are good at English is 1/3. What is the probability that they are good at music? 1 2 a ? P(A) = 0.1, P(B ) = 0.8, P(C ) = 0.7 P(A or B or C) = 0.1 + 0.2 + 0.3 = 0.6 b ? ? P(A or B) = 0.3, P(B or C) = 0.9, P(A or B or C) = 1 P(A) = 0.1 P(B) = 0.2 P(C) = 0.7 ? ? P(Music) = 7/15 c ? The probability that Alice passes an exam is 0.3. The probability that Bob passes the same exam s 0.4. The probability that either pass is 0.65. Are the two events mutually exclusive? Give a reason. 3 P(A or B or C or D) = 1. P(A or B or C) = 0.6 and P(B or C or D) = 0.6 and P(B or D) = 0.45 P(A) = 0.4, P(B)= 0.05 P(C) = 0.15, P(D) = 0.4 ? ? d ?? No, because 0.3 + 0.4 = 0.7 is not 0.65. ?
Exercise 5 (on your sheet) I am going on holiday to one destination this year, either France, Spain or America. I m 3 times as likely to go to France as I am to Spain but half as likely to go to America than Spain. What is the probability that I don t go to Spain? The following tables indicate the probabilities for spinning different sides, A, B, C and D, of an unfair spinner. Work out x in each case. 5 4 A B C D Probabilities of could be expressed as: 0.1 0.3 x ? x France Spain ? America x = 0.3 3x x 0.5x So 4.5x = 1, so x = 2/9 So P(not Spain) = 7/9 A B C D 0.5 2x 0.2 x P(A or B or C) = 1. P(A or B) = 4x 0.1 and P(B or C) = 4x. Determine expressions for P(A), P(B) and P(C), and hence determine the range of values for x. ? x = 0.1 A B C D x 2x 3x ? 4x P(C) = 1 P(A or B) = 1 (4x 0.1) = 1.1 4x P(A) = 1 P(B or C) = 1 4x P(B) = (4x 0.1) + (4x) 1 = 8x 1.1 x = 0.1 A B ? Since probabilities must be between 0 and 1, from P(A), x must be between 0 and 0.25. From P(B), x must be between 0.1375 and 0.2625. From P(C), x must be between 0.025 and 0.275. Combining these together, we find that 0.1375 x 0.25 x 4x + 0.25 ? x = 0.15
How can we find the probability of an event? 1. We might just know! 2. We can do an experiment and count outcomes We could throw the dice 100 times for example, and count how many times we see each outcome. For a fair die, we know that the probability of each outcome is 1 definition of it being a fair die. 6, by Outcome 1 2 3 4 5 6 Count 27 13 10 30 15 5 27 100 13 100 10 100 30 100 15 100 5 ? R.F. 100 This is known as a: This is known as an: Theoretical Probability Experimental Probability When we know the underlying probability of an event. Also known as the relative frequency , it is a probability based on observing counts. ? ? ? ????? =????? ?? ??????? ?????? ?? ??????
Check your understanding Question 1: If we flipped a (not necessarily fair) coin 10 times and saw 6 Heads, then 6 10 is the true probability of getting a Head? No. It might for example be a fair coin: If we throw a fair coin 10 times we wouldn t necessarily see 5 heads. In fact we could have seen 6 heads! So the relative frequency/experimental probability only provides a sensible guess for the true probability of Heads, based on what we ve observed. ? Question 2: What can we do to make the experimental probability be as close as possible to the true (theoretical) probability of Heads? Flip the coin lots of times. I we threw a coin just twice for example and saw 0 Heads, it s hard to know how unfair our coin is. But if we threw it say 1000 times and saw 200 heads, then we d have a much more accurate probability. The law of large events states that as the number of trials becomes large, the experimental probability becomes closer to the true probability. ?
Estimating counts and probabilities A spinner has the letters A, B and C on it. I spin the spinner 50 times, and see A 12 times. What is the experimental probability for P(A)? Answer: ?? ??= ?.?? ? The probability of getting a 6 on an unfair die is 0.3. I throw the die 200 times. How many sixes might you expect to get? Answer: ??? ?.? = ?? times?
Estimating counts and probabilities The Royal Mint (who makes British coins) claims that the probability of throwing a Heads is 0.4. Athi throws the coin 200 times and sees 83 Heads. He claims that the manufacturer is wrong. Do you agree? Why? No. In 200 throws, we d expect to see 200 0.4 = 80heads. 83 is close to 80, so it s likely the manufacturer is correct. ?
Test Your Understanding The table below shows the probabilities for spinning an A, B and C on a spinner. If I spin the spinner 150 times, estimate the number of Cs I will see. A Outcome A B C Probability 0.12 0.34 P(C) = 1 0.12 0.34 = 0.54 Estimate Cs seen = 0.54 x 150 = 81 ? B I spin another spinner 120 times and see the following counts: Outcome A B C Count 30 45 45 What is the relative frequency of B? 45/120 = 0.375?
Coin Activity See worksheet Again focus on a single square. As the coin can move about inside the square such that the centre of the coin is within the confines of the square (but may overlap with a line), what area is covered by the centre of the coin? ??= ????? ? c Find the experimental probability that you will win when a 1p coin is thrown. Repeat with a 2p coin. TASK 1 TASK 2 Measure the diameter of your coins: a Hence determine the theoretical probability of winning for each type of coin. Compare this with your experimental probabilities. d Coin 1p 2p 5p 2.59cm ? Diameter 2.03cm 1.80cm b Focus on a single square on the grid. As the coin can move about inside the square such that you win, what area is covered by the centre of the coin? 1p: ?.?????? 2p: ?.?????? 5p: ?.???? ? What is the probability of winning if you have a grid of ? ? size squares and a coin of diameter ?? Give your probability as an expression in terms of ? and ?. 1p: ?.??????? 2p: ?.??????? 5p: ??.????? ? ? ?? ?? ? ? ??? =
Exercise 6 (on your sheet) Dr Laurie throws a fair die 600 times, and sees 90 ones. An unfair die is rolled 80 times and the following counts are observed. 3 1 Calculate the relative frequency of throwing a 1. 90 / 600 = 0.15 b) Explain how Laurie can make the relative frequency closer to a sixth. Throw the die more times. a) a) Determine the relative frequency of each outcome. ? Outcome Count R.F. 1 20 0.25 2 10 0.125 3 8 0.1 4 4 0.05 5 10 0.125 6 28 0.35 ? b) Dr Bob claims that the theoretical probability of rolling a 3 is 0.095. Is Dr Bob correct? He is probably correct, as the experimental probability/relative frequency is close to the theoretical probability. ? The table below shows the probabilities of winning different prizes in the gameshow I m a Tiffinian, Get Me Outta Here! . 160 Tiffin students appear on the show. Estimate how many cuddly toys will be won. ? 4 An unfair coin has a probability of heads 0.68. I throw the coin 75 times. How many tails do I expect to see? P(T) = 1 0.68 = 0.32 0.32 x 75 = 24 ? 2 Prize Cockroach Smoothie Cuddly Toy Maths Textbook Skip Next Landmark Prob 0.37 x 0.18 2x x = (1 0.37 0.18)/3 = 0.15 0.15 x 160 = 24 cuddly toys ?
Exercise 6 (on your sheet) I throw a fair coin some number of times and the relative frequency of Heads is 0.45. I throw the coin a few more times and the relative frequency is now equal to the theoretical probability. What is the minimum number of times the coin was thrown? A six-sided unfair die is thrown n times, and the relative frequencies of each outcome are 0.12, 0.2, 0.36, 0.08, 0.08 and 0.16 respectively. What is the minimum value of n? 5 7 All the relative frequencies are multiples of 0.04 = 1/25. Thus the die was known some multiple of 25 times, the minimum being 25. If relative frequency is 0.45 = 9/20, the minimum number of times the coin was thrown is 20. If we threw two heads after this, the new relative frequency would be 11/22 = 0.5 (i.e. the theoretical probability) Thus the minimum number of throws is 22. ? ? A spin a spinner with sectors A, B and C 200 times. I see twice as many Bs as As and 40 more Cs than As. Calculate the relative frequency of spinning a C. 6 I throw an unfair coin n times and the relative frequency of Heads is 0.35. I throw the coin 10 more times, all of which are Heads (just by luck), and the relative frequency rises to 0.48. Determine n. [Hint: Make the number of heads after the first throws say , then form some equations] 8 Counts are x, 2x and x + 40 Thus x + 2x + x + 40 = 200 4x + 40 = 200. Solving, x = 40. Relative frequency = 80 / 200 = 0.4. ? k/n = 0.35, which we can write as k = 0.35n. (k+10)/(n+10) = 0.48, which we can rewrite as k = 0.48n 5.2 (i.e. by making k the subject) Thus 0.35n = 0.48n 5.2. Solving, n = 40. ?
REVISION! Vote with the coloured cards in your diaries (use the front for blue) ? ? ? ?
? and B are mutually exclusive events. ? ? ?? ? = 0.7, and ? ? = 0.3 What is ?(? )? 0.4 0.6 0.7 1
I throw a coin 3 times. How many possible outcomes are there? 3 6 8 9
I throw two dice and add the scores. Whats the probability my sum is less than 4? 1 18 1 6 1 12 5 36
The table shows the probabilities of each outcome of an unfair 4-sided spinner. If I spin the spinner 150 times, how many times do I expect to see D on average? A B C D 0.3 0.1 0.5 30 20 10 15
Bob buys a very expensive perfectly fair die for use in his casino. He throws it 120 times and sees 23 ones. What s the relative frequency of throwing a one? 0.182 0.192 0.202 0.212
Bob buys a very expensive perfectly fair die for use in his casino. He throws it 120 times and sees 23 ones. Is the manufacturer s claim that the die is fair correct? ???????? ??? ??? ?? ????????
Look at the following table showing the number of 100 boys and girls in a school doing geography and history for GCSE. No student is allowed to do both. Geography History Total Boys 35 25 60 Girls Total 10 45 30 55 40 100
Geography History 35 Total 60 Boys 25 Girls 10 30 40 Total 45 55 100 What is the probability that a randomly chosen student is a girl? 40 100 40 60 30 40 55 60
Geography History 35 Total 60 Boys 25 Girls 10 30 40 Total 45 55 100 What is the probability that a randomly chosen student is a boy who studies geography? 40 60 35 45 35 100 35 60
Geography History 35 Total 60 Boys 25 Girls 10 30 40 Total 45 55 100 Given a boy is chosen, what is the probability they chose geography? 40 60 35 45 35 100 35 60
Geography History 35 Total 60 Boys 25 Girls 10 30 40 Total 45 55 100 Given a someone who chose geography is chosen at random, what is the probability that they are a boy? 40 60 35 45 35 100 35 60
I throw an unfair die some number of times. I calculate the experimental probabilities of each outcome to be 0.04, 0.36, 0.12, 0.2, 0, 0.28. What s the minimum number of times I threw the die? ??? ??? ? ???? 100 20 25
I throw an unfair die some number of times. I calculate the experimental probabilities of each outcome to be 0.15, 0.2, 0.05, 0.3, 0, 0.3. What s the minimum number of times I threw the die? ??? ??? ? ???? 100 20 25


")


")
")


")
")