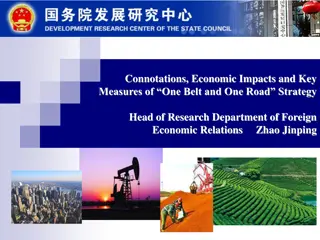
Sri Lanka-China Economic Relations and Maritime Silk Road Symposium
Explore the trade, investment, and tourism relations between Sri Lanka and China in a comparative context. Discover the evolving trade agreements and strategic significance of Sri Lanka's location in the Indian Ocean. Analyze the trade flows between Sri Lanka and major trading partners, highlighting the growth in imports from China over the years.

Download Presentation

Please find below an Image/Link to download the presentation.
The content on the website is provided AS IS for your information and personal use only. It may not be sold, licensed, or shared on other websites without obtaining consent from the author. Download presentation by click this link. If you encounter any issues during the download, it is possible that the publisher has removed the file from their server.
E N D
Presentation Transcript
Sri Lanka-China Economic Relations In a Comparative Context 2ndSymposium on Maritime Silk Road and China-Sri Lanka Relations 11th-13thof July 2016, Shanghai-China Ravindra Deyshappriya Research Director Lakshman Kadirgamar Institute Sri Lanka ravindra@lki.lk The opinions expressed in this presentation are solely those of the presenter and do not necessarily reflect those of the LKI. 1
Outline of the Presentation Trade Relations Between Sri Lanka and China Investment Relations Between Sri Lanka and China Tourism Relations Between Sri Lanka and China 10/8/2024 2
Trade Relations 10/8/2024 3
Increasing Importance of the Indian Ocean and Strategic Location of Sri Lanka Indian Ocean connects Asia-Pacific region which is the center of world economic growth and the Gulf and Africa region which is the energy and resource center. Sri Lanka s strategic location between oil shipping lines and String of Peals . 10/8/2024 4
Evolution of Trade Relations between Sri Lanka & China Sri Lanka-China bilateral trade agreement (Rubber-Rice Pact) SL imported 270,000 MT of rice and China exported 50,000 MT of rubber 1952 1952 China-Sri Lanka Maritime Agreement All commercial vessels engaged in cargo and passenger services between the two countries or a third country were treated on the basis of most favored nations treatment. 1963 1963 Sri Lanka -China General Trade Pact 1982 1982 Agreement on Economic & Trade Cooperation 1984 1984 The first Amalgamated Sri Lanka China Joint Commission The second and the third were held in 1996 and 2000 respectively. 1992 1992 Establishment of Sri Lanka China Business Council 1994 1994 Sri Lanka signed a special agreement with China in 1997 in support of Chinese admission to Asia Pacific Trade Agreement 1997 1997 Sri Lanka exchanged bilateral negotiations with China extending glowing support in favor of Chinese bid to join the World Trade Organization. 2000 2000 10/8/2024 5
Trade Flows of Sri Lanka with Major Trading Partners Exports 3000 The USA is the major exporting destination of Sri Lanka followed by the UK 1 US 2500 2 UK 2000 USD (Million) 3 India 4 Italy Export to China has been considerably low with sluggish growth 1500 5 Germany 6 Belgium 1000 8 Russia 500 9 France 14 China 0 2010 2011 2012 2013 2014 5000 4500 1 India India is the leading import partner in Sri Lanka followed by China 4000 2 China 3500 3 UAE USD (Million) 3000 4 Singapore 2500 5 Japan 2000 6 Malaysia Imports from China has been steadily increasing over the time 1500 7 Indonesia 1000 8 US 500 9 Thailand 0 10 Taiwan 10/8/2024 6 2010 2011 2012 2013 2014
China s Position at Export and Import Market of Sri Lanka China China Rank 14st Share 1.5% Value 173.47 USD (Mn) Rank 2nd Share 17.6% Value 3414.1 USD (Mn) USA Rank 1st Share 24.4% Value 2719.91 USD (Mn) India Export Rank 1st Share 20.5% Value 3977.1 USD (Mn) Import China is the 2nd best import-trading partner of Sri Lanka , whereas ranked 14th in terms of export-trading in 2014. This resulted Sri Lanka to account for huge trade deficit annually. In 1970s China was one of the best export destination of Sri Lanka.\ \ 10/8/2024 7
Trade Balance Between Sri Lanka-China (2010 2014) Sri Lanka China Trade Flows & Trade Balance Sluggish export and rocketing imports 4000 3000 2000 Further deepening dramatic trade deficit 1000 USD (Million) Import 0 Export 2010 2011 2012 2013 2014 -1000 Trade Balance -2000 -3000 -4000 India 4.53.33.32.8 China UAE 27.3 5.5 Singapore 26.4% of Sri Lanka s trade deficit is accounted by China 5.7 Japan Malaysia 9.2 Indonesia Thailand 12.1 26.4 Taiwan S. Korea 10/8/2024 8
Trade Relations: Way Forward Recognition of new exports opportunities and products Export Volume Expansion of Formulation of strategies to penetrate the requirement of Chinese cities rather than country as a whole. Conduct of awareness program about the opportunities available in the Chinese market to Sri Lankan exporters 10/8/2024 9
Investmen t Relations 10/8/2024 10
Investment Relations: Background Sri Lanka prefer to have investments/loans from China over other Western entities. Chinese investments are free of preconditions. Chinese investment can get ports and doesn t get lectures on economic reform and human rights . ( Mr. Robert O. Blake, Jr.: Former US ambassador to Sri Lanka) China s aid to Sri Lanka jumped from a few million dollars in 2005 to almost $1 billion last year (2008), replacing Japan as the biggest foreign donor . (May 2009 Times of London) Major players include Export-Import Bank of China, China Development Bank Corporation, Chinese State-Owned Bank and Government of China 10/8/2024 11
FDI Inflows to Sri Lanka & Chinas Contribution FDI inflows from China and UK upsurge from 2012 while the inflows from other countries reduce. 24.5% of total FDI inflows to Sri Lanka is from China Telecommunications, garments, power & energy and electronic manufacturing sectors have attracted Chinese FDIs remarkably. 10/8/2024 12
Foreign Financing Commitments from China Foreign Financing Commitments from Major Partners (2006 2013, USD Mn) China has been the key player of foreign financing commitments. Chinese development assistances are mainly for road and power ^ energy sectors. 10/8/2024 13
Foreign Financing Disbursement from China Foreign Financing Disbursements from Major Partners (2006 2013, USD Mn) China has accounted for by far the largest disbursement followed by Japan Both disbursement and commitments increased after 2009 and focused on road, transportation and power & energy 10/8/2024 14
Investment Relations Way Forward Chinese FDI inflows to Sri Lanka is relatively low compared to other Asian countries. FDI Inflows from China FDI Inflows from China (2013, USD (2013, USD Mn 240 3570 2849 2771 2167 2472 FDI as % of FDI as % of GDP GDP 0.36 5.75 18.68 24.87 1.26 0.64 Country Country Sri Lanka Burma Cambodia Laos Vietnam Thailand Mn) ) Asian Infrastructure Investment Bank (AIIB) and future opportunities. 10/8/2024 15
Tourism Relations 10/8/2024 16
Sri Lanka as a Tourism Destination Sri Lanka has been recognized as one of the best tourist s destination: Pearl of the Indian Ocean . Tourism as a driving force of economic growth and expected to attract 4 million tourists by 2020 and to be a major tourism hub by 2025. Tourism receipts are 2,431.1 USD Million (2014) and has created direct and indirect employment opportunities 129,790 and 170,100 respectively. Tourism arrivals and tourism receipts to Sri Lanka are relatively low compared to other regional counterparts. 10/8/2024 17
Share of Tourist Arrivals from Top Three Countries (1984 - 2015) In 1980s and 1990s , tourists arrivals dominated by German tourists followed by India and UK. India has been accounting for the largest share of tourist arrivals during the last decade, while the share of China sharply increases after 2013. 10/8/2024 18
Trend of Tourist Arrivals from Top Five Countries (2010 - 2015) Tourist Arrivals from Top 5 Tourist Arrivals from Top 5 Countries Countries 350000 Dramatic increase of tourist arrivals from China after 2013 300000 250000 Tourist Arrivals Tourist Arrivals India China UK Germany France 200000 150000 100000 Chinese tourists to surpass Indian arrivals? 50000 0 2010 2011 2012 2013 2014 2015 Tourist Arrivals and Growth Rate of Tourist Arrivals of Top 5 Countries (2015) 316,247 316,247 161,845 161,845 214,783 214,783 115,868 115,868 86,125 86,125 30% 12% 68% 13% 9% 10/8/2024 19
Tourism Relations: Way Forward Despite the arrivals of Chinese tourists increase rapidly, Sri Lanka is not at least among their top 25 destinations. Duration of stay of Chinese tourists (9.8 days) are relatively low compared to most of US and European countries. Attract high-end tourists who are willing to spend 100USD-125USD per day. Establish strong air transportation linkages between two countries. Appropriate promotional campaign to attract more Chinese tourists. 10/8/2024 20
Conclusions of the Presentation Cultural relations in the history turned in to current strong economic relations. Well-established trade relations starting from Rubber-Rice Pact (1952), however trade balance is unfavorable for Sri Lanka. During the last decade, huge investment on infrastructure development and considerable amount of FDI inflows, however still Chinese investments in Sri Lanka is relatively low compared to Chinese investment in some other Asian countries. China is the second best country in terms of tourist arrivals to Sri Lanka, however duration of stay and spending per day is relatively low. Sri Lanka is not among at least top 25 destinations of Chinese tourists. 10/8/2024 21
Thank You 10/8/2024 22
Annex 10/8/2024 23
High-Profile Meetings between Sri Lanka & China Date Sri Lankan Member Chinese Member Location Aug 2003 Nov 2004 Dec 2004 Apr 2005 Aug 2005 Mar 2006 July 2006 Sep 2006 Mar 2007 Oct 2007 Dec 2007 Apr 2008 Aug 2008 Sep 2008 Oct 2008 July 2009 Aug 2009 PM: R. Wickremasinghe President: C.B. Kumaratunge Foreign Min. L. Kadiragamar President: C.B. Kumaratunge President: C.B. Kumaratunge President: M. Rajapaksa Foreign Min. M. Samaraweera Finance Min. Jayasundera President: M. Rajapaksa Finance Min. Jayasundera Foreign Min. Bogollagama President: M. Rajapaksa President: M. Rajapaksa President: M. Rajapaksa PM: Wickramanayake Foreign Min. Bogollagama Foreign Min. Bogollagama President: Hu Jintao State Councilor: Chen State Councilor: Chen Premier: Wen President: Hu Jintao State Councilor: Tang Premier: Wen Exim Bank, Assis. Manager: Li President: Hu Jintao Exim Bank Chairman: Li Deputy Mayor: Tang President: Hu Jintao President: Hu Jintao Foreign Min. Yang Yunnan Governor: Qin Vice Premier: Li Yunnan Vice-Governor: Gao Beijing Colombo Beijing Colombo Beijing Colombo Beijing Colombo Beijing Colombo Shanghai Hainan Beijing Colombo Kunming Beijing Colombo Aug 2009 Sep 2009 Oct 2009 Dec 2009 Treasury Secretary: Abeysinghe President: M. Rajapaksa PM. Wickramanayake Treasury Secretary: Abeysinghe Exim Bank Vice President: Zhu Tianjin CPC Chief: Zhang Premier: Wen Commerce Vice Min. Chen Beijing Colombo Chengdu Beijing June 2010 President: M. Rajapaksa Chinese Vice-Premier: Zhang Dejiang Governor : Qin Guangrong Colombo Aug 2010 PM: D.M. Jayaratne Colombo 10/8/2024 24
High-Profile Meetings between Sri Lanka & China (Cont) Date Sri Lankan Member Chinese Member Location June 2011 President: M. Rajapakse President: Hu Jintao Russia Aug 2011 President: M. Rajapakse Premier: Wen Jiabao Zhongnanhai Sep 2012 President: M. Rajapakse Wu Bangguo Colombo May 2013 President: M. Rajapaksa President: Xi Jinping Beijing Sep 2013 President: M. Rajapaksa Liu Yunshan Colombo Jun 2013 PM. D.M. Jayaratne Vice Premier: Ma Kai Kunming May 2014 President: M. Rajapaksa President: Xi Jinping Shangai Sep 2014 President: M. Rajapaksa President: Xi Jinping Colombo Nov 2015 President: M. Rajapaksa President: Xi Jinping Hainan Apr 2016 PM. R. Wickremesinghe President: Xi Jinping Beijing 10/8/2024 25
Possible New Export Products Products Sri Lanka s export to the world 2012 (USD, 000) Annual growth in value of total exports to China (2008-2012) 10% Tariff rate applied to Sri Lanka in China Printed circuits 26486 0% Parts of electronic integrated circuits and micro assembles 4222 -8% 0% Chemical/allied industry preparations 1071 22% 0% Manioc (Cassava), fresh or dried, whether or not sliced or pelleted 1389 42% 8.3% Banana including plantains, fresh or dried 5692 32% 6.9% Footwear, outer soles of rubber/plastic uppers of leather 3628 18% 8.5% 10/8/2024 26
Reception of Chinese Mainland Tourists Reception of Chinese Mainland Tourists Reception of Chinese Mainland Tourists Destinations Growth (%) Foreign Countries Growth (%) (Unit in 10,000 persons) (2013) (Unit in 10,000 persons) (2007) Hong Kong 4030.33 15.3 Japan 145.81 13.9 Macau 2523.94 17.4 South Korea 131.25 19.5 South Korea 425.34 42.0 Vietnam 92.03 81.7 Thailand 401.03 78.7 Thailand 71.69 -6.5 Taiwan 291.89 11.0 Singapore 64.76 16.2 United States 196.69 14.2 Malaysia 57.35 31.8 Japan 183.46 -6.5 Australia 39.84 15.5 Vietnam 177.27 32.3 Germany 27.16 5.4 Cambodia 169.06 -8.4 Myanmar 16.38 61.2 Malaysia 135.16 -1.5 Philippines 16.00 15.7 Singapore 132.28 13.4 Cambodia 14.05 70.7 Guinea-Bissau 114.39 216.0 India 6.98 48.2 Russia 91.53 5.3 New Zealand 6.83 16.6 Indonesia 87.92 23.2 South Africa 3.88 22.6 Egypt 3.30 52.0 Australia 82.27 12.8 Nepal 2.86 81.9 Myanmar 56.13 2.8 Pakistan 2.64 -10.7 Canada 49.77 19.1 Turkey 2.39 38.7 United Kingdom 49.06 20.8 Hungary 1.60 -10.9 Italy 47.80 10.3 The Republic of Maldives 0.95 47.3 Philippines 44.65 64.0 Sri Lanka 0.69 -4.7 France 42.21 14.2 Cuba 0.39 18.6 Germany 41.51 10.2 Brunei 0.26 -7.1 Maldives 30.24 45.1 Croatia 0.10 24.2 United Arab 26.33 11.6 The Republic of Malta 0.08 19.3 Emirates Mongolia 23.64 -27.3 10/8/2024 27
The Main Exports and Imports Products between Sri Lanka and China Products Exports to China 2012 (USD, 000) 11952 10115 9658 9471 3760 Products Imports from China 2012 (USD,000) 66804 54057 Raw mattress fibre not twisted of coconuts Titanium ores & concentrates Raw mixed fibre twisted with coconut coir Black tea T-shirts, singlets and other vest of other textiles materials, knitted Tobacco, unmanufactured, partly or wholly stemmed or stripped Solid or cushioned tires, interchangeable tire treads & tire flaps Used or new rags of textile materials, not sorted Other raw mattress fibre twisted of coconuts Women/girls trousers & shorts, other textile materials, not knitted Knitted & crocheted fabric of artificial filament Woven fabric of synthetic staple fibers, containing 85% or more Dyed cotton (85% or more) Urea Cellular mobile telephones Parts of steam and other vapour turbines Knitted or crocheted fabric of cotton,nes, dyed Machines for the reception, conversion & Transmission or regenerating of voice etc, 53147 47165 42755 42692 41719 39274 3372 2286 2179 1426 1401 Superphosphates Railway/tramway passenger coaches 39220 37614 The top exports to China (2012) includes rubber products, titanium ores, coconut coir and black tea The top imports from China (2012) includes kitted and crocheted fabric of artificial filaments, woven fabric of synthetic staple fibers, dyed cotton and urea. 10/8/2024 28


")


")